Displaying 31 - 40 of 63
Dawn's picture

ECG Basics: Ventricular Fibrillation Converted With Defibrillation

A good example of ventricular fibrillation converted by electric defibrillation to what appears to be a sinus rhythm.  There is significant artifact in the post-conversion strip, but the last beat on the strip appears to have a P-QRS-T sequence.

Of course, V Fib presents without pulses, and must be defibrillated as soon as possible.  Best results are achieved by defibrillating a perfused heart, so if there is any delay from onset of V Fib, CPR should be performed to perfuse the heart prior to defibrillation.

Dawn's picture

ECG Basics: Atrial Flutter With 2:1 Conduction Ratio, Rhythm strip

One of the most frequently misdiagnosed rhythms, atrial flutter with 2:1 conduction often masquerades as sinus tach.  Sinus tach usually has an obvious cause, such as exercise, severe hypovolemia, or age less than 6 months.  Atrial flutter usually produces flutter waves (P waves) at a rate of 250 - 350 per minute.  Therefore, a 2:1 conduction ratio would result in a heart rate of about 125 - 175 bpm).  

Often, students are taught about atrial flutter using an electronic rhythm generator or a book with limited illustrations, and they become acustomed to seeing atrial flutter with 3:1 or 4:1 conduction.  The flutter waves are very easy to see in such a situation.  However, the AV node, if not affected by medication, is usually well able to conduct at a rate of 150 or more.  Therefore, the physiological block that protects us from extreme rates will keep the heart rate around 150 bpm in atrial flutter.

This is a single rhythm strip.  It can be VERY helpful to look at multiple leads to look for flutter waves.  See this week's Instructors' Collection ECG of the WEEK for the SAME patient's 12-Lead ECG.  Also, your students should be reminded that sinus rhythms, including sinus tach, tend to change rates based on the needs of the patient.  For example, as a patient is treated for his/her condition, the rate may improve by slowing.  Conversely, if the condition becomes worse, or the patient is stressed, the rate may increase.  Atrial flutter, like all re-entry tachycardias, tends to stay at a steady rate unless the conduction ratio changes.

Show your students that the flutter waves are CONTINUOUS.  That is, they don't pause for the QRS.  The second illustration shows the flutter waves highlighted, to aid in seeing the continuous line of flutter waves.

Dawn's picture

ECG Basics: Baseline Artifact

This rhythm strip shows normal sinus rhythm, slightly on the fast side of normal at 95 bpm.  The baseline undulates up and down with the movements of the patient's chest as she breathes.  One way to correct this problem on a monitor strip is to move the limb electrodes away from the chest and onto the limbs.

Dawn's picture

ECG Basics: 60-cycle Artifact

Here is a good example of 60-cycle interference artifact on a sinus rhythm strip.  The artifact is caused by electrical interference from a nearby electrical appliance. Modern monitors are able to filter interference out, but it is still occasionally seen.  Even though we can still discern P waves in this strip, and we can see that the rhythm is irregular, possibly sinus arrhythmia, the artifact prevents us from accurately evaluating the strip.  Every effort should be made to identify the offending device.  In "ECG Basics", we attempt to stay "basic", but if any of our Gurus would like to comment on this in a more technical fashion, it is welcome.

Dawn's picture

ECG Basics: Normal Sinus Rhythm

We try to remember to include some good old "Normal Sinus Rhythm" strips from time to time.  Teachers often have large collections of strange and unusual strips that their colleagues have saved for them.  But, then they find themselves resorting to electronic rhythm generators for samples of "normal".  Here is a strip from a healthy, 23-year-old woman showing NSR.  The rate is 65 bpm, QRS duration 76 ms, PRI 136 ms, QTc 410.  There are no abnormal ST segments or T wave changes.  There are very slight rate changes from beat to beat, and the P waves appear to change morphology a bit.  This can be due to the patient's breathing movements, and we would not delve too deeply into this in light of the fact that this is an ECG from an asymptomatic young ECG student.  Absolute precision would come from an generator, but rarely from a human being. This is a good strip to teach rate and interval determination.

Dawn's picture

ECG Basics: Pacemaker Failure to Capture

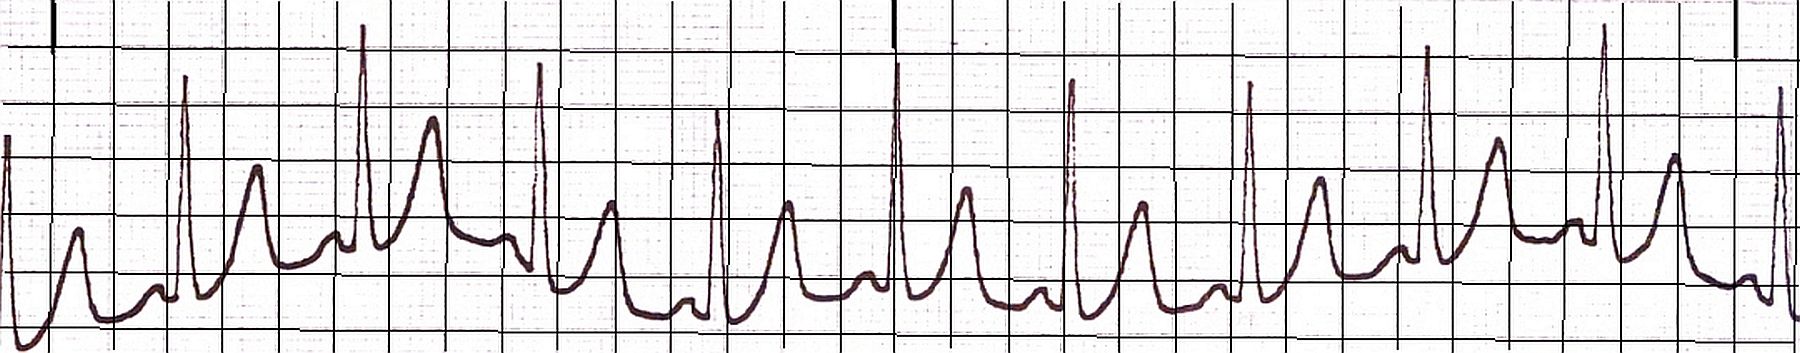
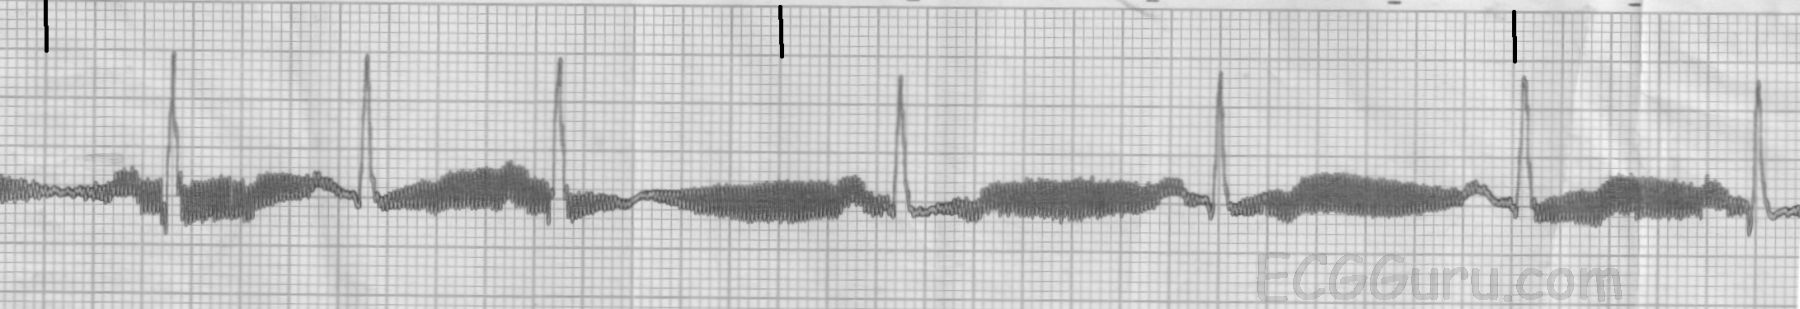
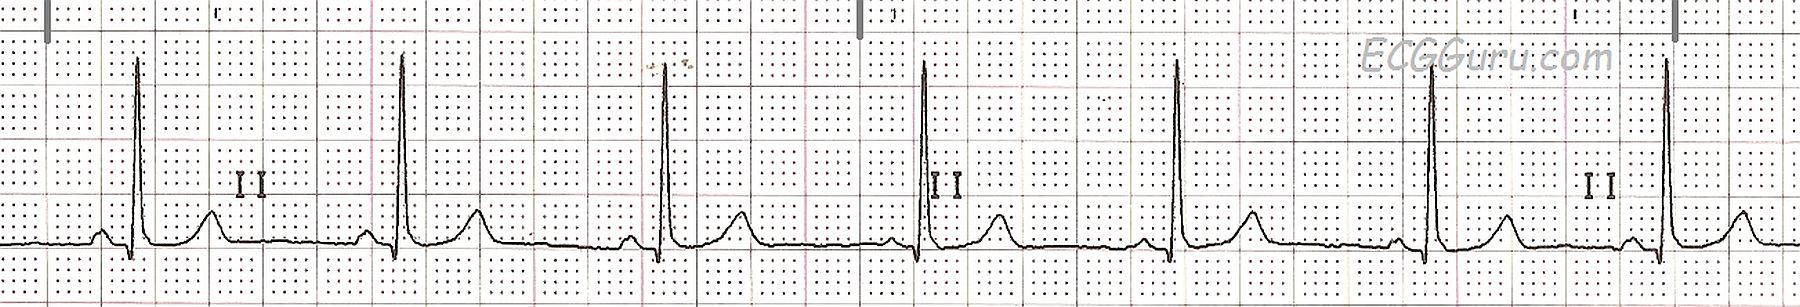
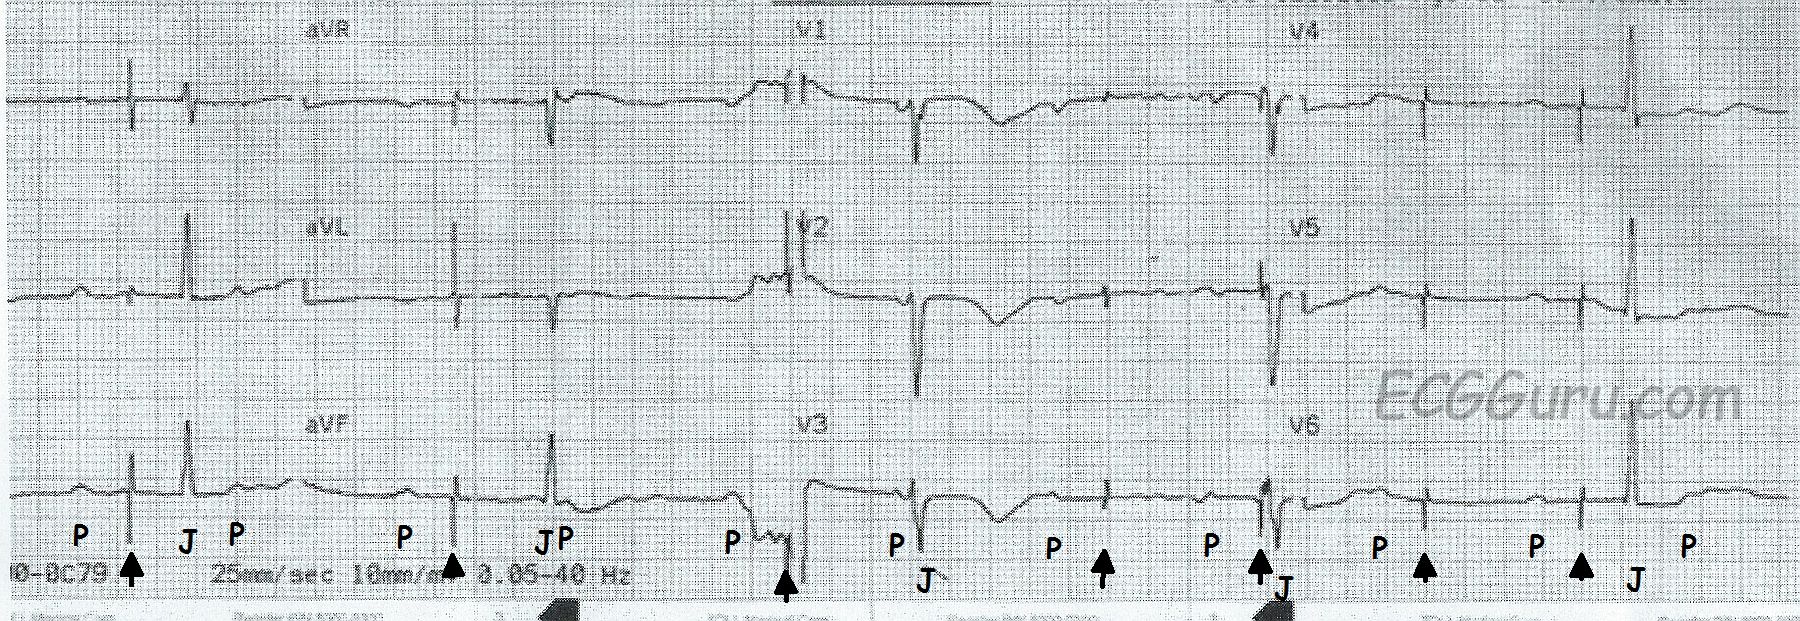
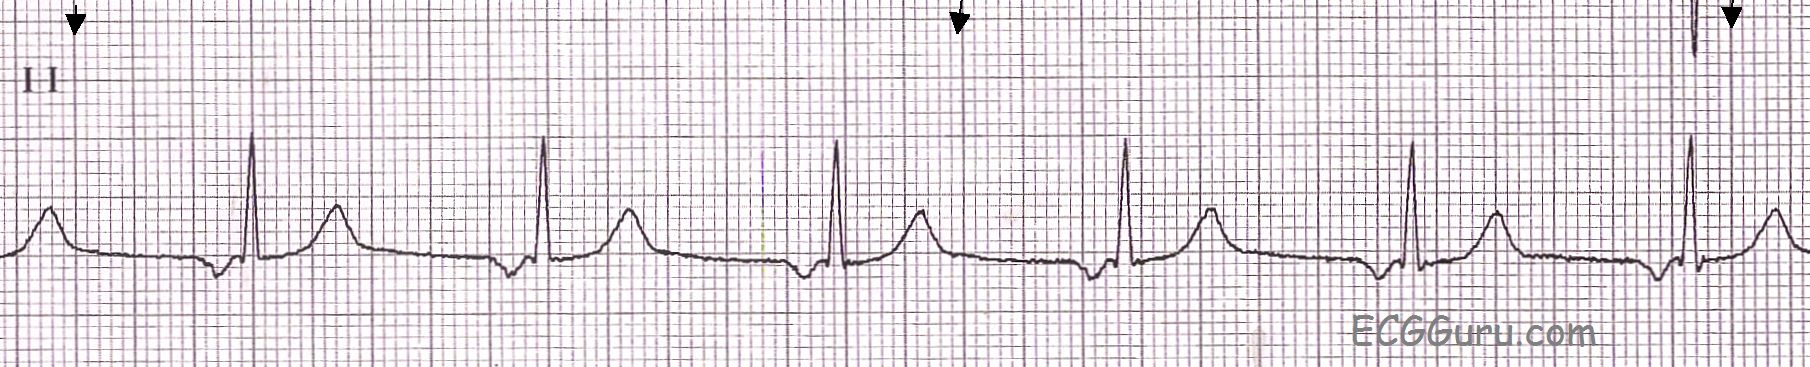
This ECG is taken from a patient with an implanted pacemaker who was experiencing near-syncope.  She was taken to the hospital by EMS, where the pacemaker was adjusted to obtain ventricular capture.  This ECG did not have a Lead II rhythm strip, so the 12-lead ECG is being presented.  The P waves have been marked with a "P", pacemaker spikes marked with an arrow, and the QRS complexes marked with a "J" because they are junctional.  Because we can see 12 leads, or viewpoints, the morphology of the P waves and QRS complexes changes each time the machine switches to a new lead.

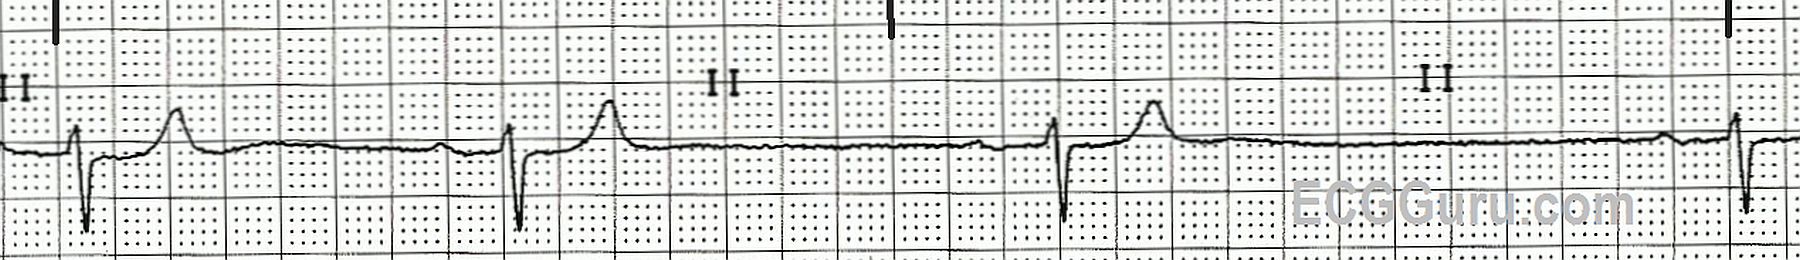
The underlying rhythm is sinus, with nearly regular P waves occuring at a rate of about 72 beats per minute.  The QRS complexes are also regular, but they are dissociated from the P waves.  Because the rate is near or just under 40 bpm, and the QRS complexes are narrow, this represents a slow junctional rhythm.  Because both atrial and ventricular rhythms are regular, but not associated with each other, an interpretation of complete heart block (third-degree AV block) can be made.  This explains why the patient had a pacemaker implanted.

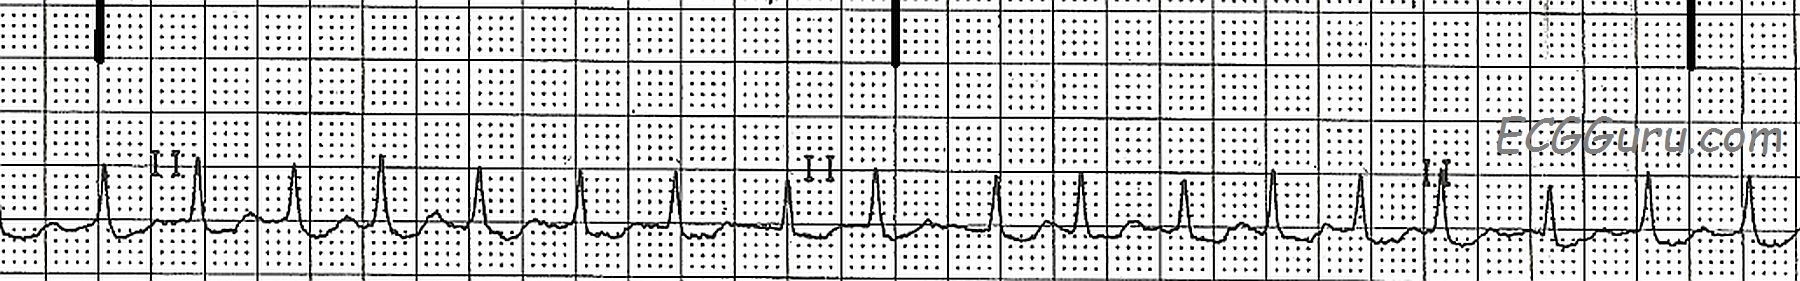
The pacer spikes, for the most part, track the P waves, which is how this pacemaker is programmed.  They are not followed by a paced QRS complex, however.  This is failure to capture.  The second and fourth P waves did not stimulate a pacer spike because of their proximity to the T wave of the junctional beat.  The mA (energy setting) was adjusted in the Emergency Dept., and the pacemaker did not require repositioning.  The patient regained a reliable paced rhythm.

This section of the ECG Guru is meant to be for your basic students.  Pacemakers now have become very complex, with many options and variable settings.  So complex, that I would not feel comfortable getting into any more detail than I have here (although visitors to the site are welcome to).  It is important that, if you deal with patients in an emergency setting, you do not tell the patient that "something is wrong with their pacemaker" until it has been evaluated by a qualified person who can electronically interrogate the device.  It can be very difficult to determine from an ECG how a pacemaker is programmed, and how it should be reacting.  Since this patient had symptoms related to the bradycardia, and since pacemaker spikes occurred free of any refractory period and did not produce QRS complexes, it is safe to say there needs to be an adjustment.

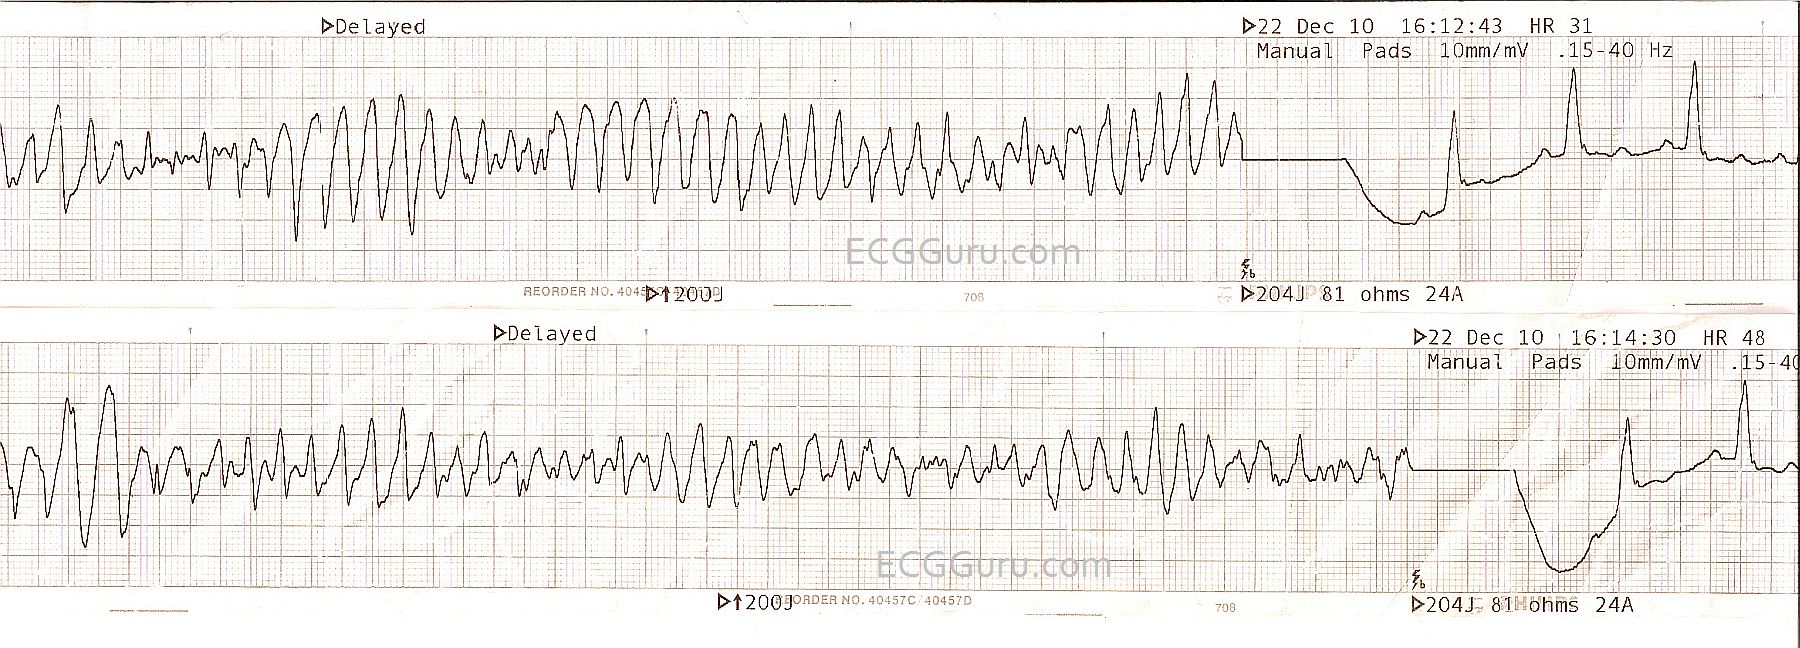
In an emergency, with serious symptoms present, a transcutaneous or transvenous temporary pacemaker can be used.  Medications such as Atropine, epinephrine, and norepinephrine are also used, depending upon the type of AV block and the resources available.


Dawn's picture

ECG Basics: Atrial Fibrillation With Rapid Ventricular Response

This is a good rhythm strip to use to illustrate how atrial fibrillation can almost look regular when the rate is fast.  Students should be taught how to "march out" the rhythm for regularity.  It is always a good idea with atrial fib to take a longer strip, looking for the inevitable "gaps" in the R-to-R intervals.  Also, as your students progress, a 12-lead ECG is invaluable to really search for P waves.  Even two or three simultaneous leads are better than just one.

Dawn's picture

ECG Basics: Sinus Bradycardia With First-degree AV Block

This is a nice teaching strip of a slowing sinus bradycardia that began around 40 bpm, and is slowing.  It is a good example of how the sinus node slows down - there is no abrupt change of rates, rather a change with each R-to-R interval.  There is also a first-degree AV block, reflecting slowing of conduction in the AV node.  The PR interval is slightly variable at .28 sec. to about .32 sec.  This is a good strip to begin talking about treatment of bradycardias with beginner students, as there is no second- or third-degee AVB, but the patient is very likely to be symptomatic now, or very soon.  Atropine would probably improve this rate in a symptomatic patient, but if there is time, a 12-Lead would be a good idea to rule out acute M.I.  Inadvertently raising the rate too much in the injured heart can lead to pump failure, while leaving the patient poorly-perfused in a bradycardia will starve the heart.  A transthoracic or temporary IV pacemaker might be a better choice for some patients because of our ability to choose the rate.

Dawn's picture

ECG Basics: Junctional Rhythm

A basic rhythm strip showing junctional rhythm in Lead II.  The junctional pacemaker is located between the atria and the ventricles, and the resulting P wave is caused by retrograde conduction through the atria.  This causes the P wave to be negatively deflected in Lead II.  In junctional rhythms, the P wave can occur just before the QRS, during the QRS, or after the QRS, or may not be seen at all.  If the P wave occurs before the QRS, the PR interval is usually short, reflecting the fact that the atria and the ventricles are depolarized almost simultaneously.  In this example, the PRI is .12, on the short side of normal.

The junctional pacemakers have a slow intrinsic rate so that the sinus node can remain in control of the heart's rate under normal circumstances.  If the sinus rate drops below the intrinsic rate of the junctional pacemaker, the junction will take over control of the heart.  An idiojunctional rhythm is generally between 40 and 60 bpm.  In this example, it is about 63 bpm.

Dawn's picture

ECG Basics: Torsades Cardioverted

These two strips are from one patient who was electrically cardioverted twice in a few minutes.  The original reason for the cardioversion was Torsades de Pointes, a type of polymorphic ventricular tachycardia associated with a long QT interval.  For more information about TDP, go to this LINK.  It is a bit difficult to comment on the patient's post-cardioversion rhythm, because so little of it is shown.  It appears to be sinus, with a wide QRS.  The QT interval appears slightly prolonged at .44 sec, but it is not known what the QT interval is corrected to a rate of 60/min.  TDP is often seen with QT intervals greater than 600 ms (.6 seconds).  Also THESE STRIPS ARE NOT SIMULTANEOUS, they were taken two minutes apart.  In the first one, the P waves and T waves look so much alike, they could all be P waves.  They do not "march out".  It is necessary to get a long strip, preferably in multiple leads, and a 12-Lead ECG, to properly evaluate the rhythm post-cardioversion. 

Pages

All our content is FREE & COPYRIGHT FREE for non-commercial use

Please be courteous and leave any watermark or author attribution on content you reproduce.