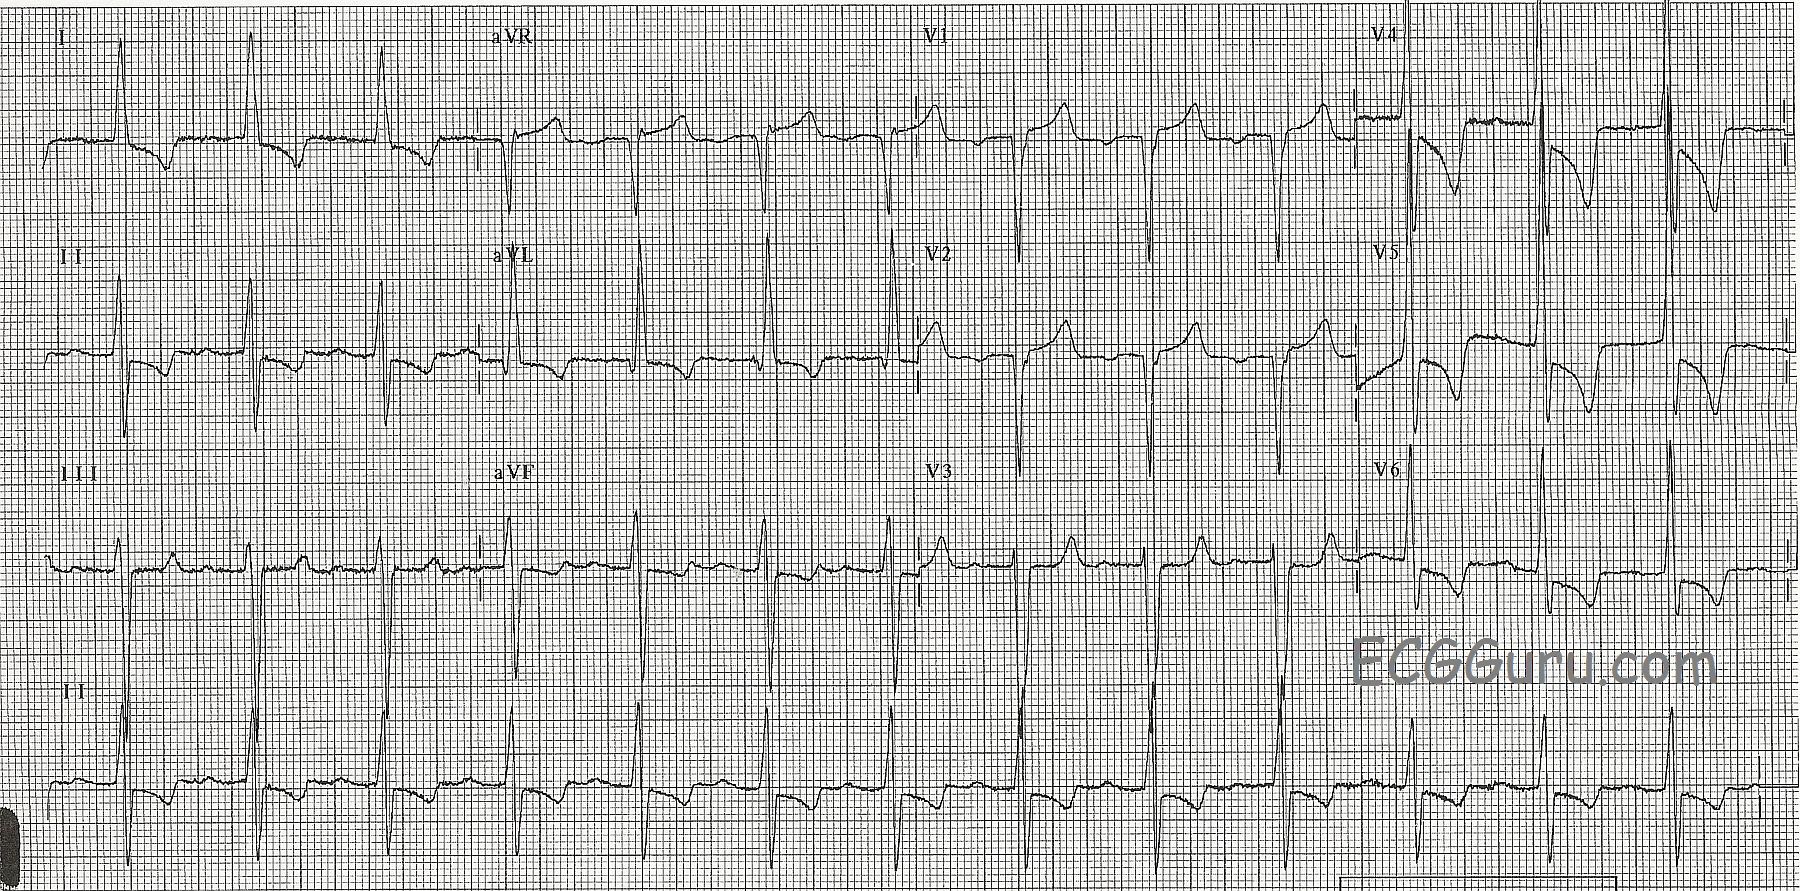
This ECG is from a man with left ventricular hypertrophy. LVH causes taller-than-normal QRS complexes in leads oriented toward the left side of the heart, such as Leads I, II, aVL, V4, V5, and V6. Leads on the opposite side, such as V1, V2, and V3, will have deeper-than-normal S waves. A commonly-used criteria for determination of LVH is the Sokolow-Lyon index: S in V1+ R in V5or V6(whichever is larger) ≥ 35 mm (≥ 7 large squares); and R in aVL ≥ 11 mm. There is no perfect ECG criteria for determining LVH. The most accurate way to evaluate the size and thickness of the chambers of the heart is echocardiogram (ultrasound). Frequently, there is left axis deviation, especially if the hypertrophy is confined to the left ventricle.
The left ventricle can be enlarged for many reasons, some worse than others. Athletes naturally enlarge the heart, as they work the muscle. Pathological causes for LVH can include anything that strains the heart as it pushes against increased afterload, such as hypertension and aortic stenosis, and diseases of the myocardium, such as cardiac myopathies.
TODAY, we are starting a new feature on the ECG GURU. ECG BASICS will provide rhythm strips and 12-leads for your beginner or refresher students. It can be discouraging to the entry-level student to see only intermediate or advanced material and not understand it. We must remember to start at the most elementary concepts, and then build on them, just as we do with any other subject. Even more advanced students sometimes benefit from a return to the "basics". In this weekly feature, you will find downloadable content that is, like all ECG Guru content, FREE for use in an educational context. Please let us know in the "Comments" section below what ECGs, rhythm strips, or illustrations you would like to see featured in this new area.
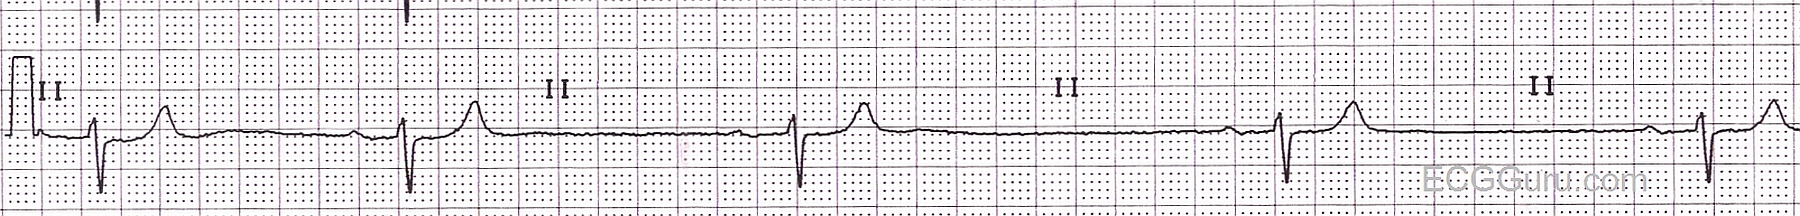
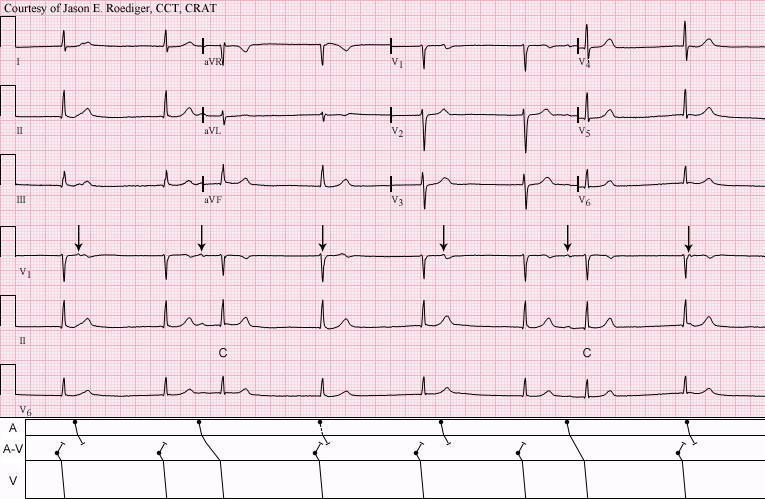
Today's strip: Sinus bradycardia with first-degree AV block. The rate is in the 30's and slowing, and the PR interval is .26 seconds.
This is a good ECG for demonstrating sinus brady and first-degree AV block. It shows the sinus node in the process of slowing down. For your more advanced students, there is left axis deviation due to left anterior fascicular block (left anterior hemiblock). The ST segments are flat, suggesting coronary artery disease. The fourth (bottom) channel is a good rhythm strip. Just crop the image. Please refer to Dr. Grauer's interesting post on teaching hemiblocks on our Ask The Expert page.
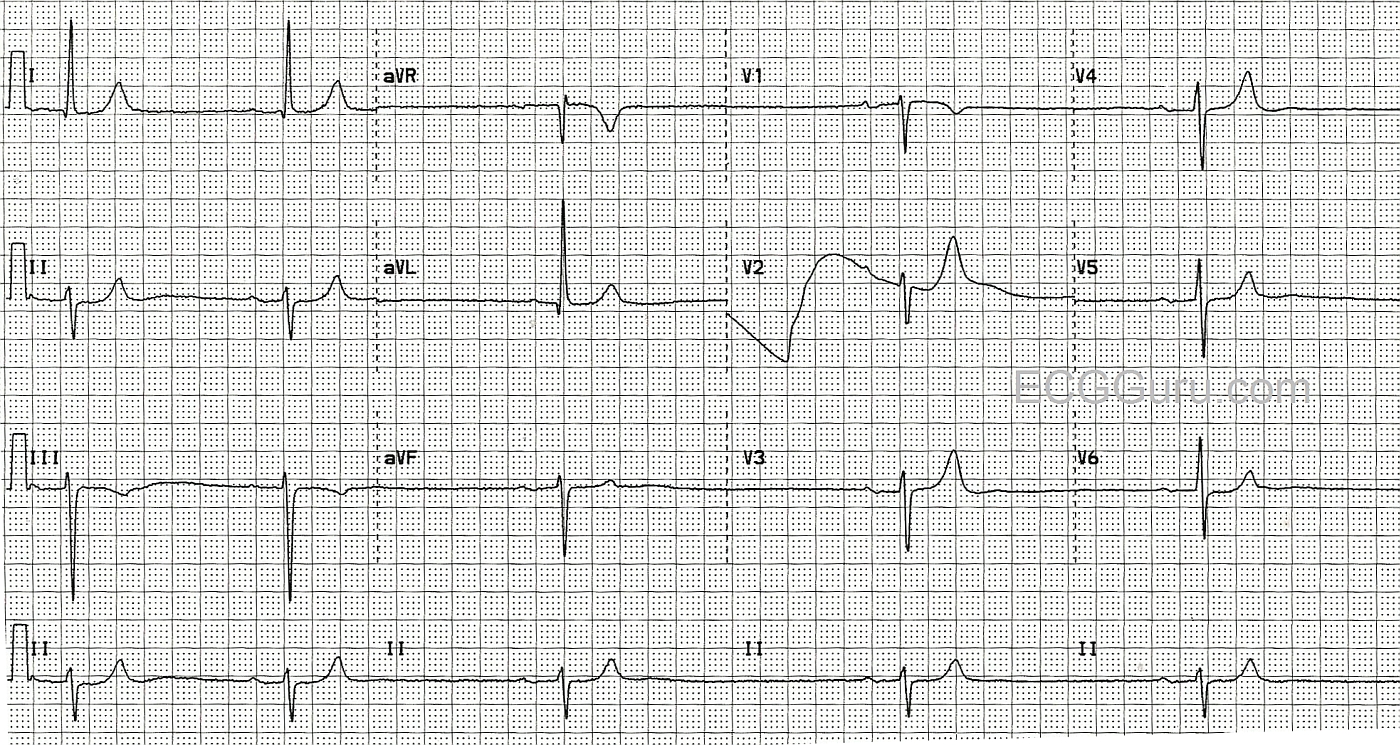
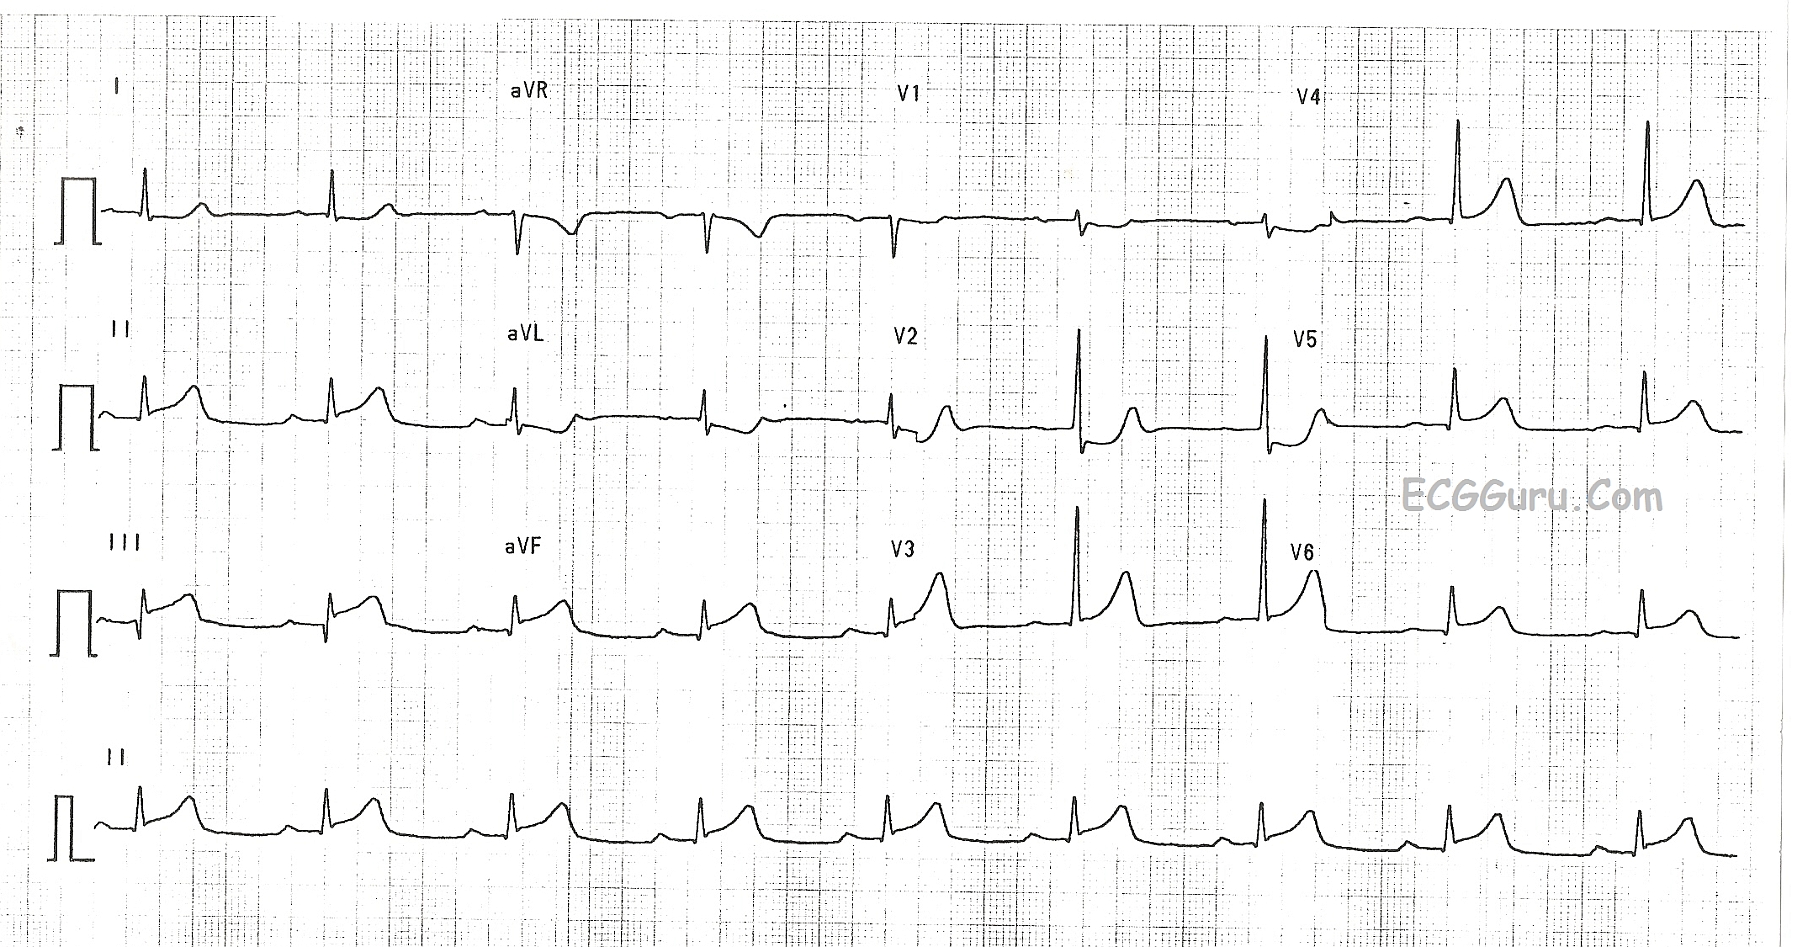
Inferior wall MI: ST elevation in II, III, and aVF. Reciprocal ST depressions. Sinus bradycardia and first-degree AV block suggests sinus node and AV node ischemia. This is a good "classic" inferior wall M.I. It is good for teaching inferior-posterior injury, and the effects of RCA occlusion on the sinus and AV nodes. The low voltage in the limb leads may also be due to acute M.I., but in this case, we do not know the patient's body size.
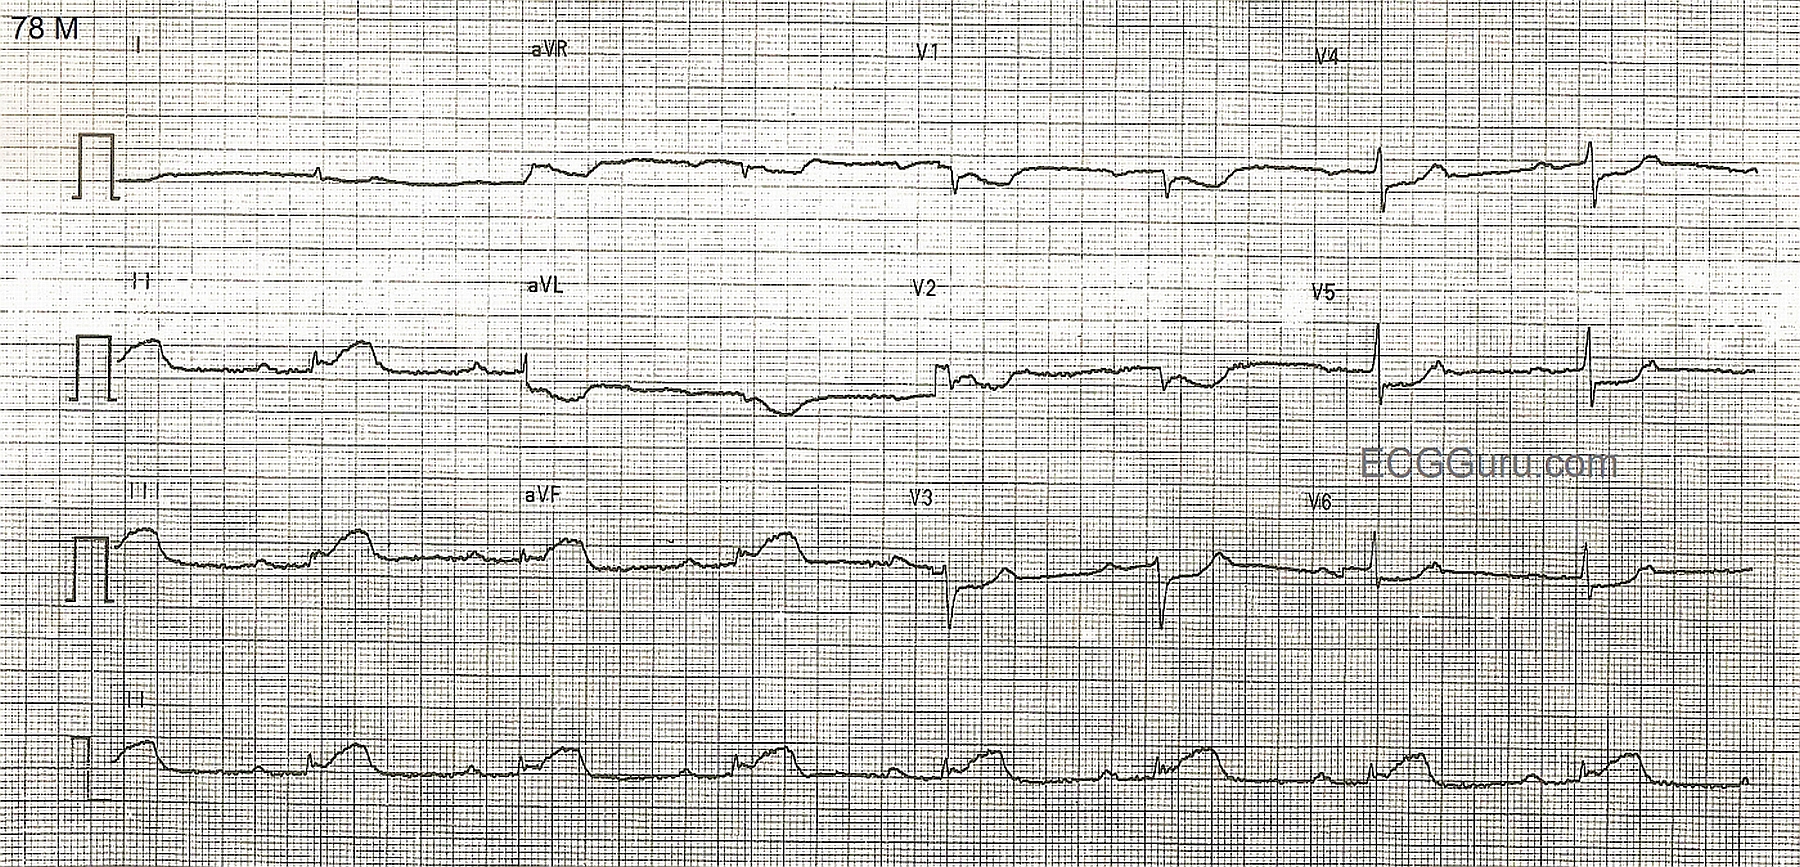
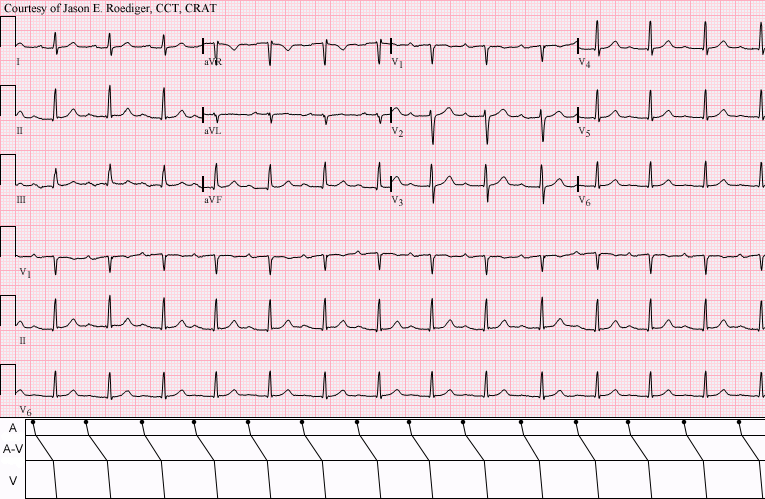
This patient was seen by his primary care provider (PCP) on an outpatient basis. The PCP decided to send her patient over to me to perform a routine ECG and establish a baseline, hince the computer's statement below of "No previous ECGs available". I printed out the above 12-lead ECG and became slightly concerned with the rhythm I was seeing. Consequently, I also recorded six full pages of continuous rhythm (not shown here). I don’t ordinarily resort to doing this except on those rare
This ECG shows a classic inferior - posterior STEMI. This M.I. was due to complete occlusion of the right coronary artery. ST elevation apparent in Leads II, III, and aVF show the acute injury in the inferior wall, while ST depressions in V1 and V2 are reciprocal of the ST elevations in the posterior wall. The tall R waves in Leads V1 - V3 most likely are reciprocal to pathological Q waves in the posterior wall. Tall R waves in the right precordial leads can be caused by other cardiac conditions, such as right ventricular enlargement. RV hypertrophy can probably be ruled out in this case because there is no right axis deviation or P pulmonale. Because inferior wall M.I.s often extend into the posterior wall, it is the most likely cause of the tall R waves.