Displaying 61 - 67 of 67
Dawn's picture

Inferior Wall M.I. With Angiogram and Ventriculogram


This ECG was taken from a 66-year-old woman who presented to the emergency department complaining of chest pain and shortness of breath.  She attributed her symptoms to her COPD, but stated that her aerosol treatment had not helped.  She waited for some time before deciding to go to the hospital, then drove herself. In the emergency department, she had blood drawn, an I.V. started, and an aerosol treatment of albuterol.  She was then taken to the radiology dept. for a chest xray.  When she returned, a 12-lead ECG was done.  45 minutes had passed since she first arrived at the hospital.  This ECG is shown here.  It shows ST elevation in the inferior leads:  II, III, and aVF.  The patient was taken immediately to the cath lab, where her right coronary artery was found to have a 100% occlusion. (See image accompanying this ECG).  Angioplasty was successful, and stents were placed in the artery.  The patient was found to have anemia, with a hemoglobin of 5.5, and she was given a blood transfusion.  During the cath procedure, a ventriculogram was performed, which showed a stunned and akinetic inferior wall.  Unfortunately, subsequent ventriculogram performed several weeks later showed the lack of motion of the inferior wall to be permanent.  The ventriculogram is also posted here, and at this YouTube link, so you will be able to show your students the mechanical effects on the heart of a delay to treatment in acute STEMI.  See our YouTube site for more ventriculograms and cath videos.

Dawn's picture

Inferior Wall ST-elevation M.I.

This is an excellent example of acute inferior wall ST elevation M.I. (STEMI) in a 78 year old woman who had been experiencing intermittent chest pain for two days.  This 12-lead ECG has been formatted to simultaneously produce three rhythm strips below the 12-Lead.  The rhythm strips are run simultaneously with the 12-Lead, and show 3 different leads.  This feature can been invaluable when trying to decipher complex rhythms.

In this case, the patient is in normal sinus rhythm, and has classic ST segment elevation in the inferior wall leads:  II, III, and aVF.  There is some reciprocal ST depression in Leads I and aVL, and also in V1 and V2, suggesting injury extending up the posterior wall. ST depression is noticeable in V6 as well.  This patient's RCA lesion was opened and stented, and she did well immediately post cath.  We have no records past that.


Dawn's picture

Left Main Coronary Artery Occlusion

This ECG was provided by Jamie Bisson, of E Advanced Healthcare.

The patient, in cardiogenic shock, was resuscitated in the Emergency Department, then sent to the cath lab, where his left main coronary artery was opened and stented.

Many people with complete occlusion of the left main do not survive. When there is some diminished blood flow through the blocked area in the proximal LAD or left main, this pattern may appear. Look for ST elevation in aVR greater than or equal to 1 mm, ST elevation in aVR greater than the ST elevation in V1, and widespread ST depression.   

In this ECG, aVR and V1 show ST segment elevation, with widespread ST depression. For years, aVR was virtually ignored in the literature, and considered to be only a reciprocal view of the lateral inferior wall. Now, there is convincing evidence of its usefulness in discovering proximal left coronary artery occlusion and severe triple vessel disease. ST elevation in aVR can be a reliable sign of ischemia of the basal part of the heart and the proximal IV septum.

Many people with complete occlusion of the left main do not survive. When there is diminished blood flow through the blocked area in the proximal LAD or left main, this pattern may appear. Look for ST elevation in aVR greater than or equal to 1 mm, ST elevation in aVR greater than the ST elevation in V1, and widespread ST depression.

For complete discussions on this topic, go to Life in the Fast Lane,

Dr. Smith's ECG Blog,

JACC


Dawn's picture

Anterior Wall M.I. With Bifascicular Block

This is a good example of acute anterior wall M.I., with ST elevation in V1 through V6, as well as in Leads I and aVL.  The extensive distribution of ST segment elevations across the anterior and high lateral walls indicates a proximal LAD artery occlusion.  In addition, this ECG shows right bundle branch block, with a QRS width of 144 ms (.14 sec.) and an rsR' pattern in V1. There is also a wide s wave in Lead I which is partly obscurred in V6 by the ST elevation.  The right axis deviation (98 degrees) suggests a left posterior fascicular block which, when coupled with the RBBB, is a bi-fascicular block.  P waves are difficult to see.  Do you think they are found at the end of the QRS complexes, representing a long first-degree AVB?  Look at leads V3 through V6 for clues.

Please feel free to add your comments below.  The more "gurus" the better.

A good ECG to teach your students that a patient facing a life-threatening emergency may have a "normal" rate and regular rhythm.  There is something in this ECG for beginners through advanced students.

Dawn's picture

Inferior Wall M.I.

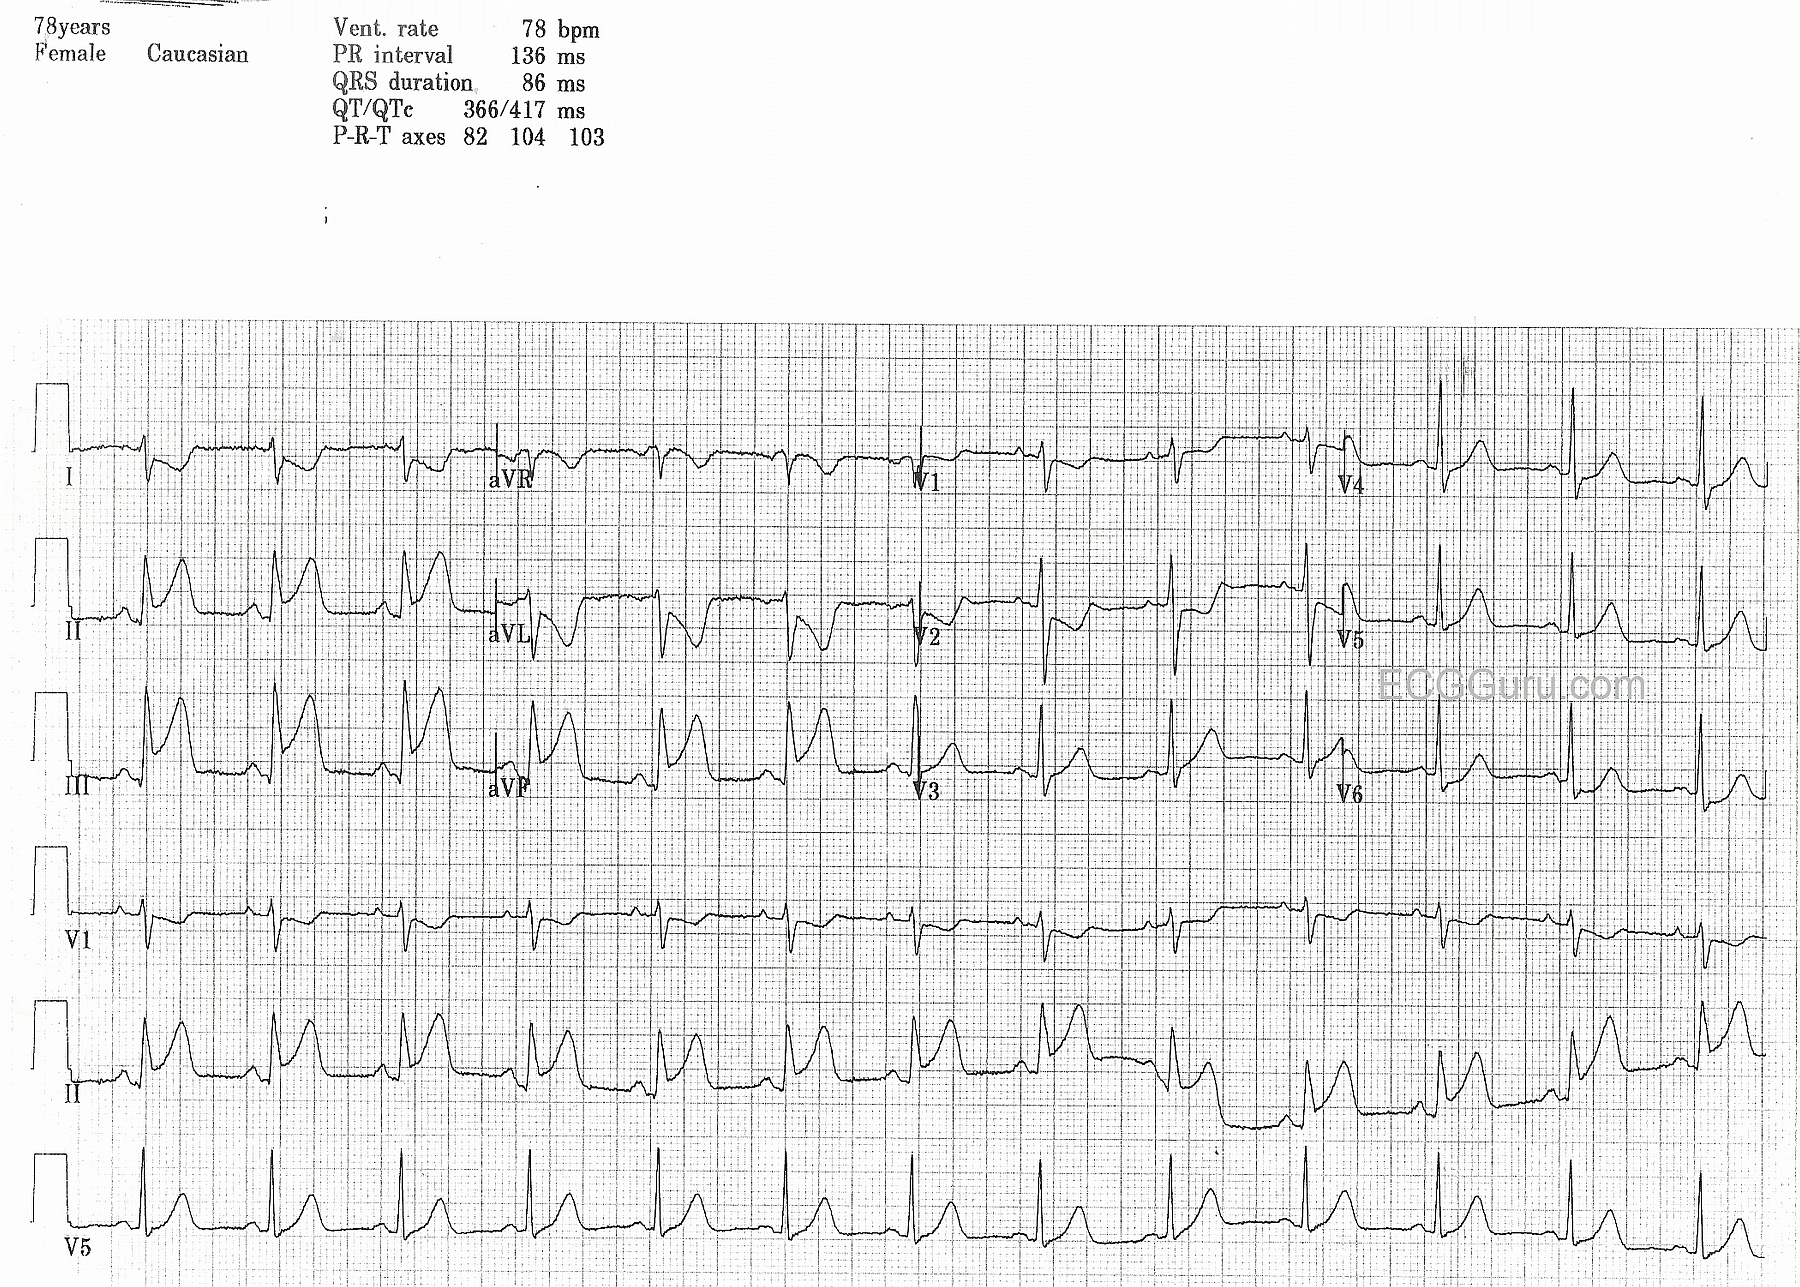
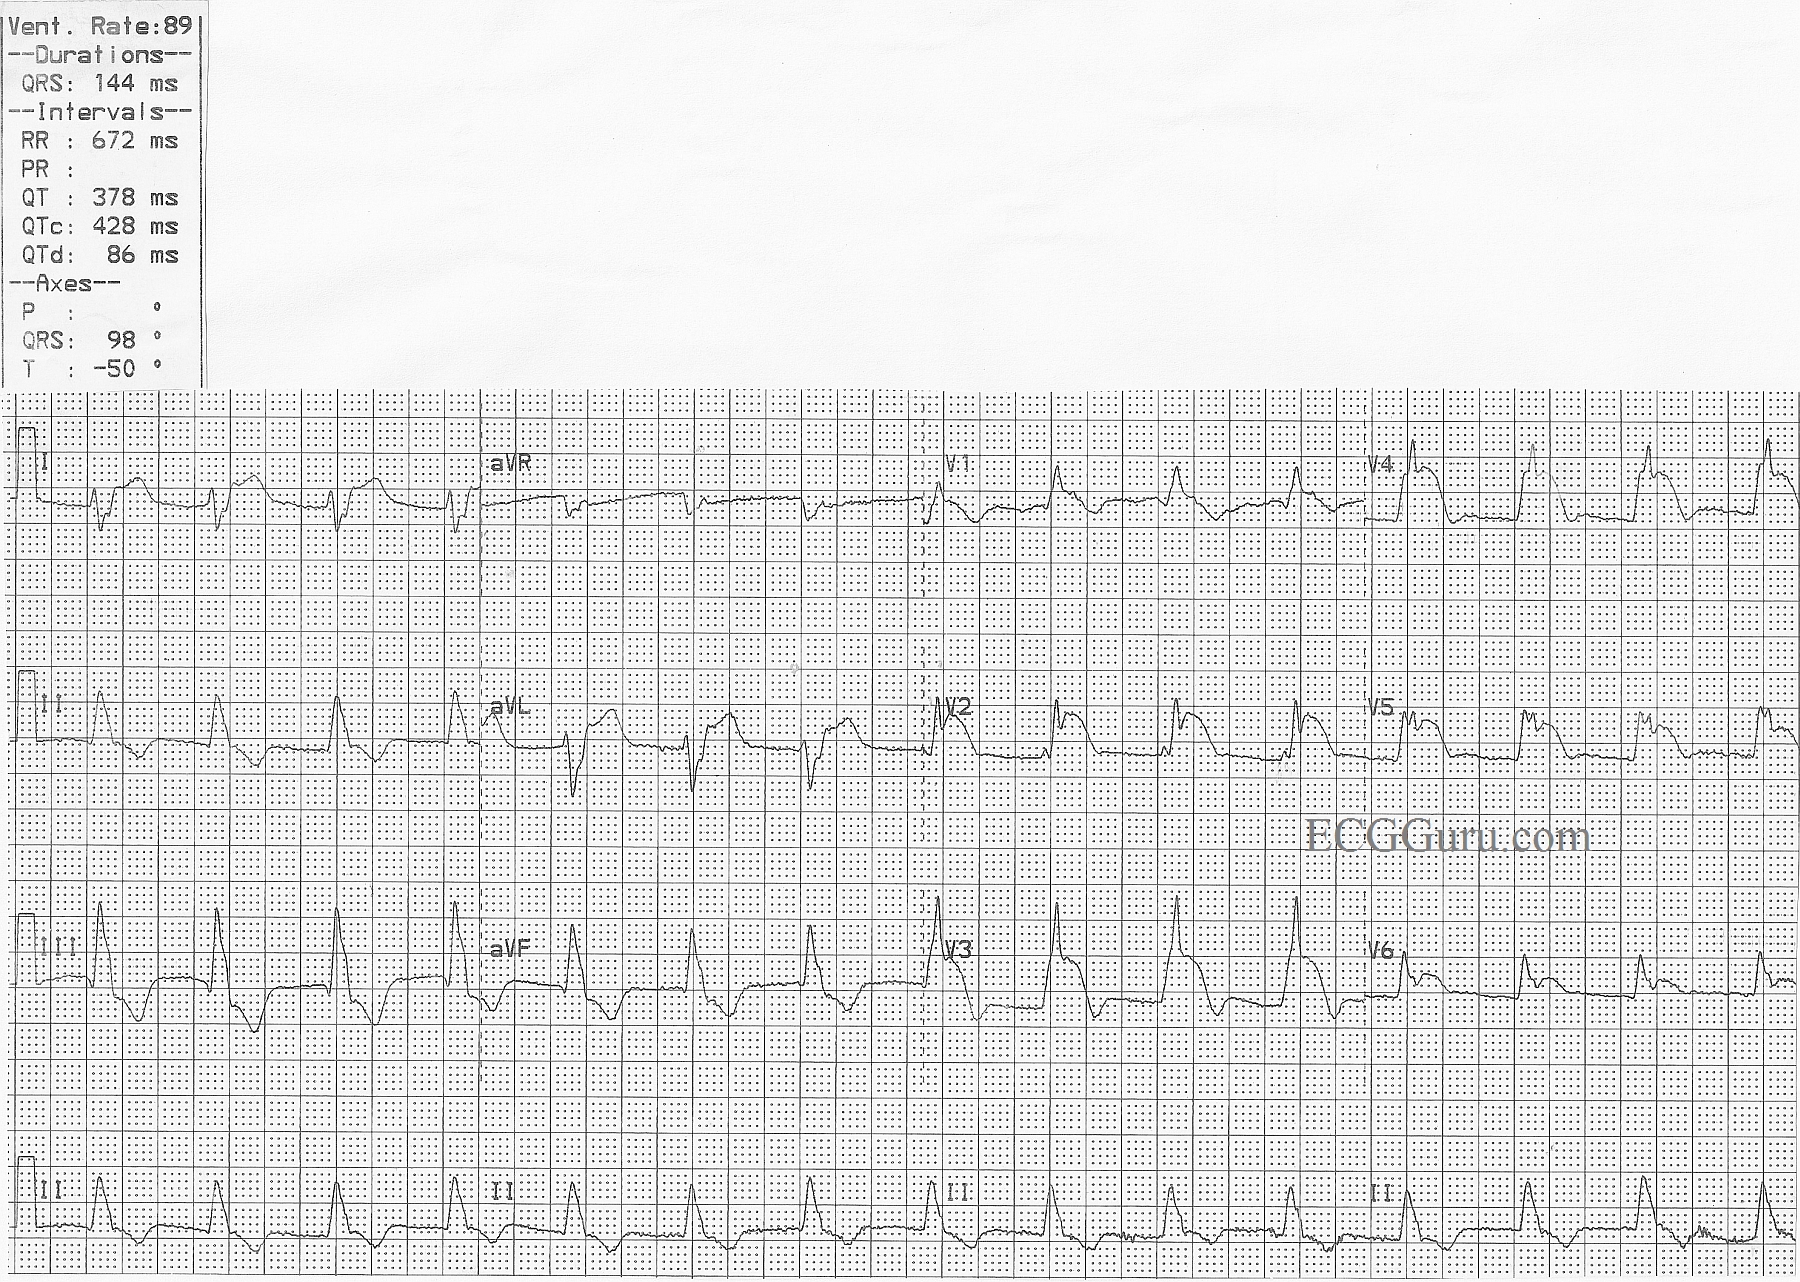
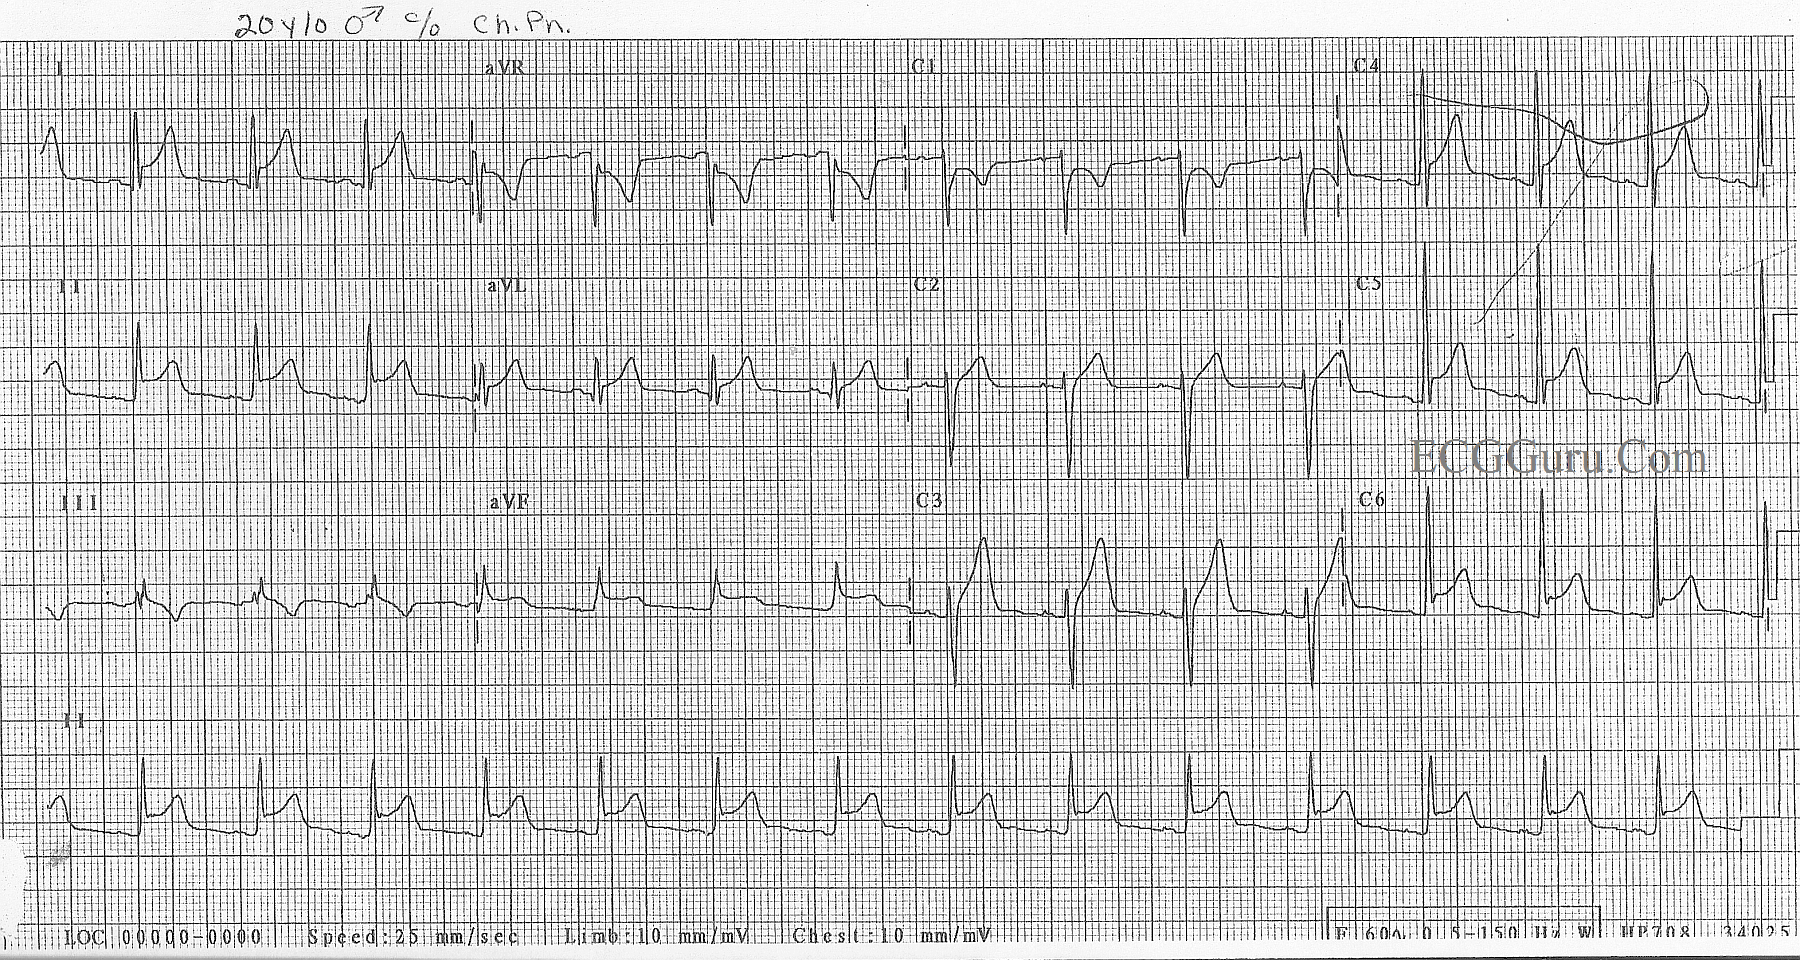
In this ECG, there is ST elevation in II, III, and aVF and reciprocal ST depression in I and aVL, indicating acute inferior wall M.I. Also, this patient has developed pathological Q waves in III and aVF, and probably II as well, indicating permanent damage to the myocardium.  A ventriculogram or echocardiogram will confirm akinesis of the inferior wall in most cases.  In this ECG, there is no ST depression in V1 through V3, so we can hope the posterior wall has been spared.  Notice the flattening of the ST segments in the elevated leads.  This is a sign of CAD.  Last week's ECG had coved upward (frowning) ST segments, which are even more sinister looking.  Lead V1 has the flattening, and a pathological Q wave.  When V1 looks "sick" and V2 looks "well", there is a good probability of right ventricular injury as well.  Lead III has a taller ST segment than Lead II.  This has also been shown to be a marker of RVMI.  Regardless, a right-sided ECG, or at least a V4 right, should be obtained in any IWMI, since the RCA often supplies both the right ventricle and the inferior wall of the left ventricle.

The rhythm in this ECG is interesting, as well.  It appears to be sinus, but it is difficult to evaluate P waves.  In the Lead II rhythm strip, they appear to change in morphology. Because the R to R interval remains constant, we feel this change in appearance is due to baseline artifact caused most likely by patient movement such as breathing.  What do you think?  

Our thanks to Andrew Porter for contributing this ECG.
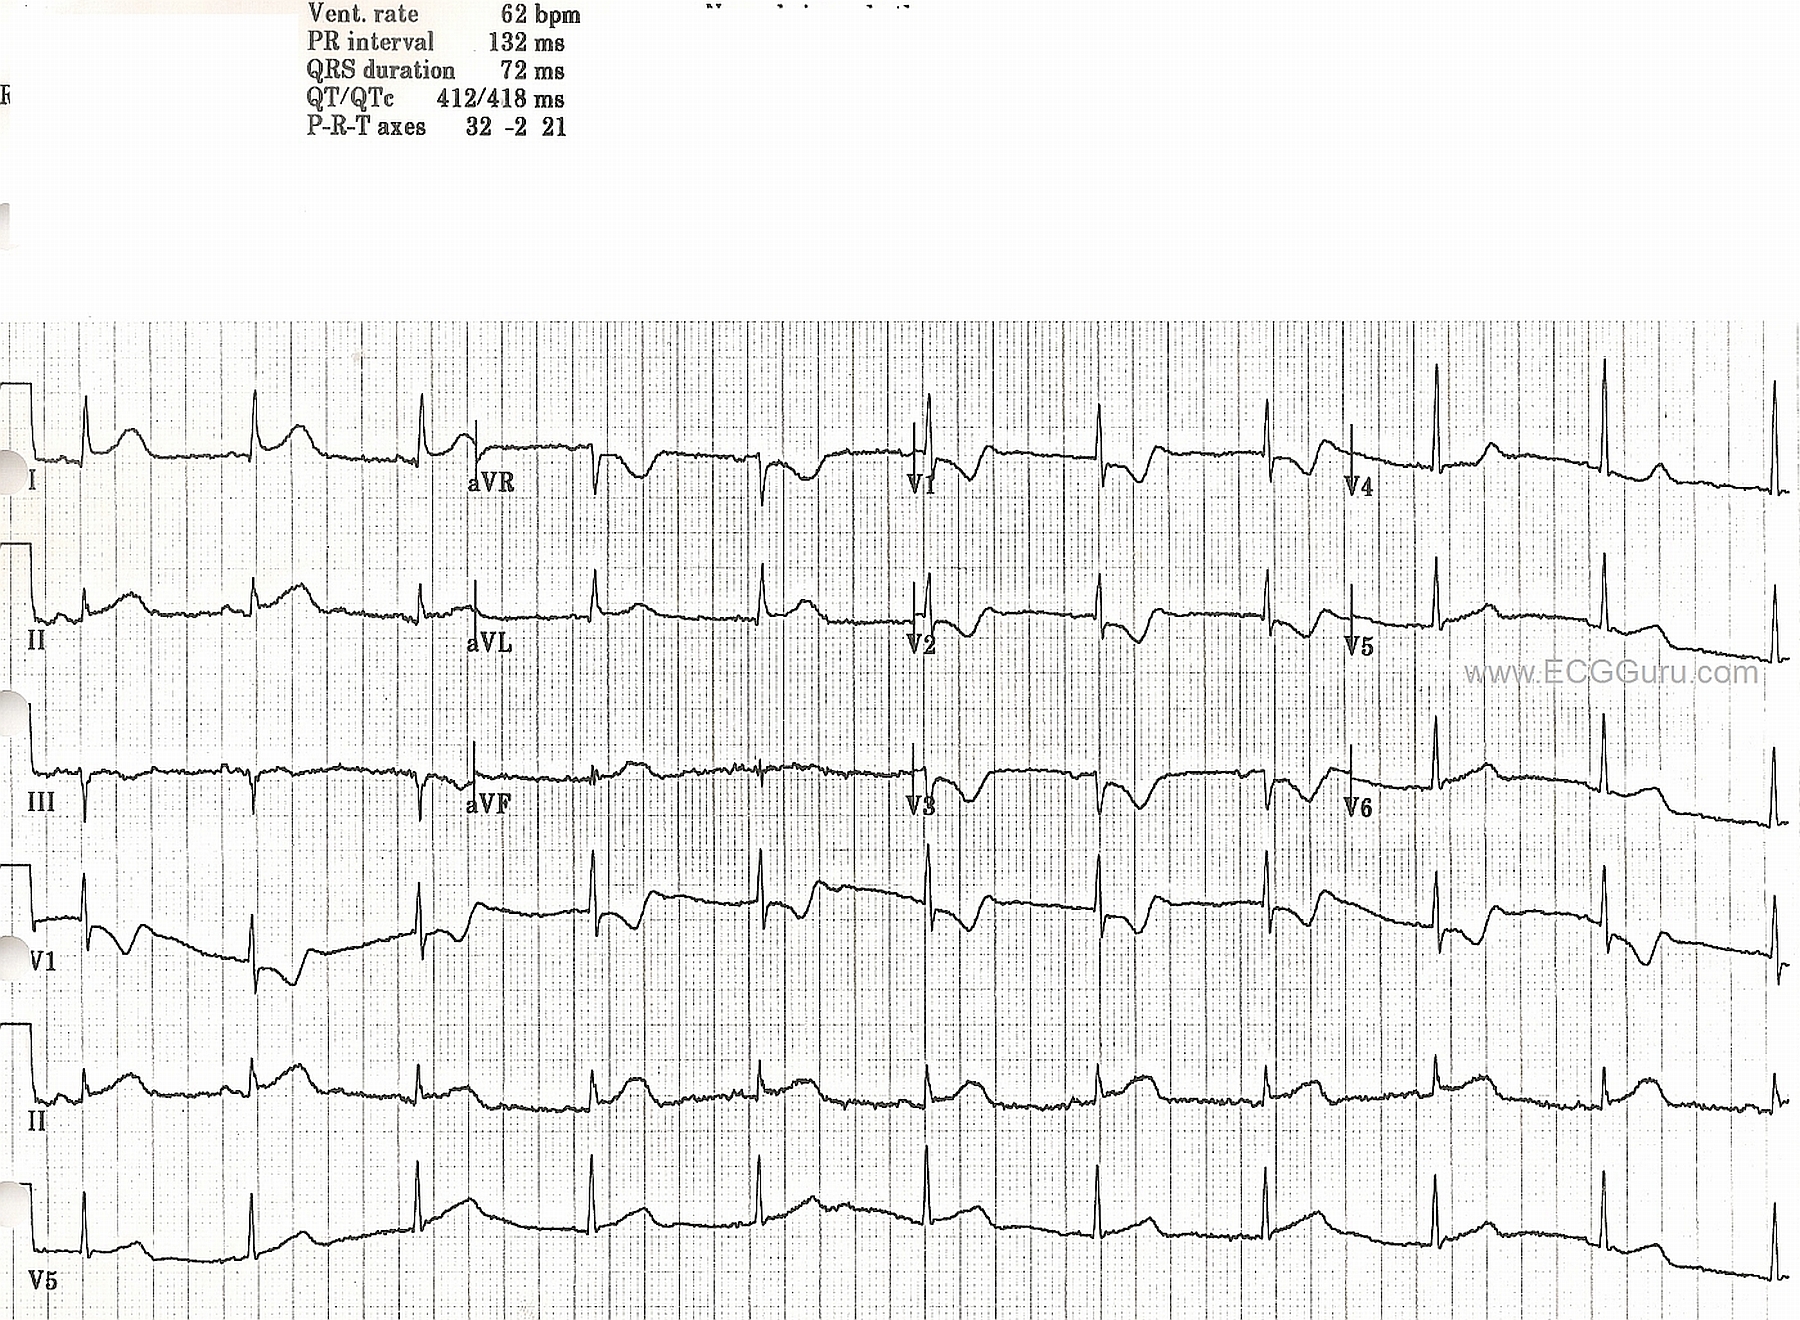
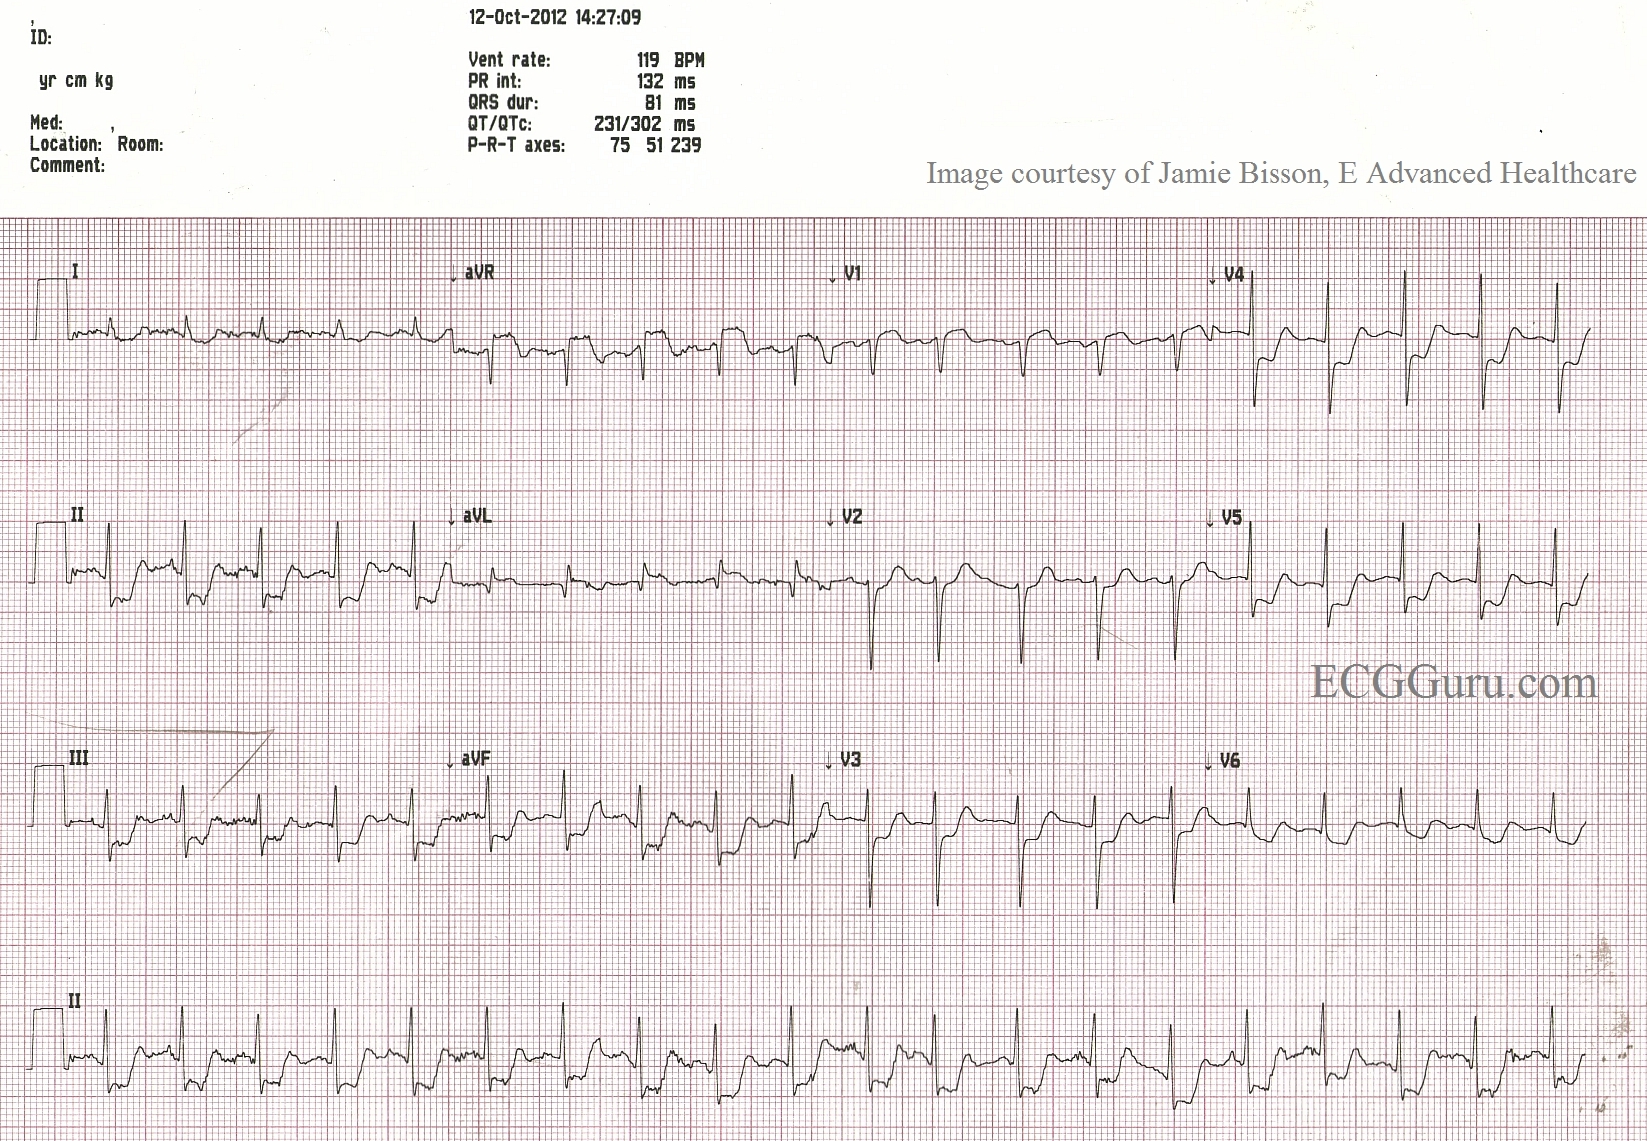
Dawn's picture

Atrial Pacing in a Patient With Acute Inferior Wall M.I.

Some people have been taught (incorrectly) that an electronic pacemaker prevents us from seeing an acute ST elevation M.I.  Not true.  It can be difficult to interpret ST elevation M.I. in the setting of WIDE QRS complexes.  When this situation exists, it is best left to the experienced ECG interpreter to determine whether there is STEMI.  In this ECG, we see ATRIAL pacing.  The patient has an intact AV conduction system.  The pacemaker paces the atria, and the impulse continues normally through the AV node and the ventricles.  The QRS that results is normal (narrow).  In this situation, the ST segments are accurate for determining ST elevation and depression.

This patient is a 74-year-old man who complained of chest pain for five days before presenting to his primary physician at the outpatient clinic.  After obtaining this ECG, the PCP transferred his patient to the Emergency Department.  He was admitted to the CCU with troponin level of 2.13 ng/ML. (Normal < 1.5 ML)


Our thanks to Jason Roediger, ECG GURU, for contributing this ECG.


Dawn's picture

Pericarditis

Today, we reprise an ECG originally published in 2012.  We welcome comments and questions, and all questions will be answered by one of our experts.

This 20-year-old man was feeling "sick", with a fever and malaise.  He also complained of chest pain, which was partly relieved by sitting forward.  He had a recent history of IV drug use.  This ECG shows the tell tale signs of pericarditis:  1)  widespread ST elevation without the other signs of M.I.  He has no T wave inversions, reciprocal ST depressions, or pathological Q waves.    2) He has a subtle depression of his PR segments, which can be a difficult sign to see.  3) Spodick's Sign, a downsloping of the RP segment.

Additionally, his ST elevations are similar throughout the ECG, in height and in shape.  Acute M.I. usually shows variations in the ST changes as we look closer to the center of the injury, or at the outskirts.

Pages

All our content is FREE & COPYRIGHT FREE for non-commercial use

Please be courteous and leave any watermark or author attribution on content you reproduce.