Displaying 31 - 40 of 67
Dawn's picture

Subtle ST Elevation And Left Anterior Hemiblock

We have no clinical information about this patient, except that he was complaining of chest pain, and was initially treated by prehospital paramedics.

ST Changes      The paramedics noted a slight J point elevation in the precordial leads, specifically about one mm of elevation in Leads V2, V3, and V4.  In addition, the ST segments are curved downward like a frown in V1 and straight in the remaining precordial leads. Because of the patient’s symptoms, and the ST abnormalities, they notified the hospital that they believed this was a STEMI.  The patient was transported without complications, and the Emergency Department physician subsequently downgraded the initial assessment of STEMI Alert.  We do not have access to follow up. These ST segments are abnormal, but do not necessarily indicate an acute ST-elevation M.I. (STEMI). A flat or “frowning” ST segment DOES suggest coronary artery disease, and the patient’s symptoms are worrisome.  However, before activating the cath lab emergently, it is sometimes preferable to observe the patient, check cardiac enzymes and other lab results, and repeat ECGs. 


Are These ST Changes Due to Acute M.I.?   There are several accepted guidelines in use for evaluating ST segments for STEMI.  Some are simplified for ease of use, and some are very detailed, taking into consideration the patient’s age and gender. There are ECG features that INCREASE the chances of ST elevation being due to acute M.I.  These features include:

·        ST elevations are in related leads

Dawn's picture

Inferior Wall M.I. With Subtle ST Elevation

This ECG is a good example of an inferior wall M.I. that was confirmed and treated in the cath lab.

The ST segments are elevated in Leads II, III, and aVF, but the amount of elevation may look subtle to some.   When the amount of elevation seems small, what other signs can help us recognize acute ST-elevation M.I.? 

PATIENT HISTORY AND PRESENTATION   This patient had acute chest pain, and was over the age of 50. We do not know his past medical history. His chest pain was described as substernal and epigastric, radiating to his back.  He had nausea and diaphoresis.  His past medical history is unknown, but it would be significant if he had a history of coronary artery disease, past M.I., smoking, metabolic syndrome, strong family history of heart disease, etc.

ST SEGMENT ELEVATION DISTRIBUTION   In acute STEMI, the elevation will be seen in “related leads”. That is, the leads that are affected will reflect a region of the heart that is supplied by the same artery. Some M.I.s are larger than others, affecting more leads, because some obstructions are more proximal than others in the artery.  This ECG shows STE in the inferior wall leads:  II, III, and aVF.  The culprit artery for this patient was the right coronary artery, which supplies the inferior and posterior wall of the left ventricle, the right ventricle, and the right atrium in the majority of people.

RECIPROCAL ST DEPRESSION   Finding reciprocal ST depression in the leads that are OPPOSITE the affected leads is a very reliable sign to confirm that the STEs are due to an acute M.I.  In fact, often the reciprocal depression is “stronger” or easier to see than the elevation.  It is important to teach your students how the standard leads are oriented to the heart, so they will recognize the 12-Lead ECG as a “map” of the heart.  The reciprocal ST depression in this ECG is seen in Leads aVL and I (subtle), which are across the frontal plane from Lead III.   We also note reciprocal ST depression in the precordial leads, especially notable in Leads V1 through V3.  This can reflect the injured area extending up the back of the heart from the inferior wall (posterior wall).  The R waves in V2 and V3 are a bit higher than normally expected, which could indicate a reciprocal view of pathological Q waves on the posterior wall.  Print the ECG out on paper, turn it upside down, and look at V2 and V3 through the back.  V2 and V3 will look like a “classic” STEMI.  This should be approximately the view you would get from additional posterior leads.

Dawn's picture

Inferior Wall M.I.

This ECG shows a common manifestation with inferior wall M.I., BRADYCARDIA.  We see the signs of acute inferior wall M.I. in the inferior leads:  II, III, and aVF all have ST segment elevation.  There almost appear to be pathological Q waves in Leads III and aVF.  There are still VERY tiny r waves, and the downward deflections are not wide, but should full-blown Q waves develop in these leads, they would signify necrosis in the area.  A repeat ECG would certainly be warranted. 

Another sign that there is an inferior wall STEMI is the ST segment depression in Leads I and aVL, which are reciprocal to Lead III.  ST depression can have many meanings, but when it is localized in the leads which are opposite ST elevation, it is reciprocal.  There is also ST depression in Leads V1 and V2.  These leads are reciprocal to the POSTERIOR wall, otherwise known as the upper part of the inferior wall.  If an inferior wall M.I. is large enough, it can produce ST elevation in the posterior leads (not performed in this case), and ST depression in the anterior leads, especially V1, V2, and V3. 

The rhythm is a marked sinus bradycardia, at just under 40 beats per minute.  Sinus bradycardia is very common in inferior wall M.I., because the inferior wall and the sinus node are usually both supplied by the right coronary artery.  AV blocks can also occur because the AV node is also supplied by the RCA in most people. 

It is important to remember that bradycardia does not always need to be treated.  In patients with acute M.I., a well-tolerated bradycardia may actually be beneficial to the injured heart, reducing supply/demand ischemia.  A well-tolerated bradycardia is a rate that does not produce low blood pressure and poor peripheral perfusion.  Some people tolerate rates in the 40’s quite well.  If the patient shows signs of poor perfusion: low BP, decreased mentation, pallor, shortness of breath, the rate should be cautiously increased with medication or electronic pacing.  


Dawn's picture

Anterior Wall M.I.

This is a very interesting ECG taken from an acute M.I. patient.  Your basic level students will be able to appreciate the ST elevation in V1 through V3. Although the elevations are not very high, there are plenty of other abnormalities that point to acute STEMI: the ST segments are flat and there are marked ischemic T waves in the lateral leads: V4 through V6 and I and aVL.  The patient was suffering an acute episode of chest pain.

It is also noticeable that R wave progression in the precordial leads (V1 through V6) is not optimal, as there is still a significant S wave in V6.  We do not know if this is an electrode placement issue or not.  The QT interval is just at the high limit of normal.  
For your more advanced students, aVR has ST elevation.  It is not reciprocal of an ST depression in Lead II.  Research has shown that ST elevation in aVR and V1, especially when the ST elevation is greater in aVR, is a strong indication of proximal LCA or a Left Main occlusion.  Unfortunately, we do not have cath results for this patient.  In acute M.I. patients,  higher mortality rate has been associated ST elevation in aVR.

For more information about ST elevation in aVR, click here: https://login.medscape.com/login/sso/getlogin?urlCache=aHR0cDovL3d3dy5tZWRzY2FwZS5jb20vdmlld2FydGljbGUvNTg5Nzgx&ac=401

and here:  http://content.onlinejacc.org/cgi/content/full/38/5/1355


Dawn's picture

Second-Degree AV Block, Type I

This ECG is from an 80-year-old woman who had an acute inferior wall M.I. with a second-degree AV block.
 
Some people incorrectly call ALL second-degree AV blocks that are conducting 2:1 "Type II".  This is incorrect, as Mobitz Type I can also conduct with a 2:1 ratio.  The progressive prolongation of the PR interval will not be seen with a 2:1 conduction ratio, because there are not two PR intervals in a row.

This is a good example of a Type I, or Wenckebach, block which is initially conducting 2:1.  At the end of the ECG, two consecutive p waves conduct, showing the "progressively-prolonging PR interval" hallmark of a Type I block. Type I blocks are supraHisian - at the level of the AV node - and generally not life-threatening.  Blocks that are conducting 2:1 present a danger, however, in the effect they have on the rate.  Whatever the underlying rhythm is, the 2:1 block will cut the rate in half!  This patient has an underlying sinus tachycardia at 106, so her block has caused a rate of 53.  In light of her acute M.I., that rate is probably preferable to the sinus tach. This patient’s BP remained stable, and she did not require pacing. 

The ST signs of acute M.I. are rather subtle here. Note the "coving upward" shape in Lead III, and the reciprocal depressions in I, aVL, V1, and V2.  Type I blocks are common in inferior wall M.I., since the AV node and the inferior wall often share a blood supply - the right coronary artery. 

While the print quality of this ECG is not the best, it is a great teaching ECG because it starts out with 2:1 conduction, then at the end of the strip, proves itself to be a Wenckebach block.   

Dawn's picture

Acute Inferior Wall M.I. With Right Ventricular M.I. and Atrial Fibrillation

This 31-year-old man presented to the Emergency Dept. complaining of chest pain, shortness of breath, and nausea. His heart rate on admission was 120 - 130 bpm and irregular, and the monitor showed atrial fibrillation. His rate slowed with the administration of diltiazem. His 12-lead ECG shows the classic ST elevation of inferior wall M.I. in Leads II, III, and aVF. This patient also had JVD, bibasilar rales, orthopnea, and exertional dyspnea, signs of CHF. He had no history of acute M.I., CHF, or atrial fibrillation. He offered no history of drug use or medications.

This ECG is very useful for the basic student, in that the ST elevations are readily seen, and the atrial fib is definitely irregularly-irregular. For the more advanced student, the ST depression in V2 indicates posterior wall injury, while the flat ST segment in V1 indicates a possible right ventricular M.I.  While the posterior wall is trying to depress the ST segment, the right ventricle is trying to elevate it, resulting in flattening. Also, Lead III has a greater STE than Lead II, which has been shown to be a reliable indicator of RV infarction.  This should be confirmed with a V4 right, or all chest leads done on the right side. Right ventricular injury has been shown to increase mortality, and it also requires different management of hemodynamics.

Dawn's picture

Left Main Coronary Artery Obstruction

Today’s ECG of the WEEK comes from Sebastian Garay, Paramedic.  He presented it on his excellent website CardioCareConcepts.com, and was kind enough to share it with the ECG Guru.  It is a great example of LEFT MAIN CORONARY ARTERY lesion with ST elevation in aVR and V1.

The patient was a 68 year old man who presented with a sudden onset of chest pain, followed by cardiac arrest.  He was revived by the use of an automatic external defibrillator (AED).  The initial 12-Lead ECG shows atrial fibrillation with a rapid response of 102 bpm.  There are prominent ST ELEVATIONS in aVR and somewhat more subtle STEs in V1.  These leads reflect the base of the septum, which is the area perfused by the proximal left coronary artery.  A lesion in this area is sometimes in the LEFT MAIN coronary artery, or both the proximal LCA and the circumflex.  Both of these types of lesions carry a very high mortality rate.

The widespread ST depressions reflect the injury current, which is being directed upward and toward the patient’s right shoulder, causing a reciprocal depression in all leads except aVR, V1 and Lead III.

This patient arrived in the Emergency Dept. in grave condition and was taken to the cath lab, where an occlusive lesion was found in the LEFT MAIN coronary artery.  He later died from this severe injury.

We recommend further reading on this topic, as there has been a large body of research on ECG findings of ST elevation in aVR.  Here are some links of interest:


Dr. Smith’s Blog;   JACC Online; ScienceDirect.com.

Dawn's picture

Inferior-Lateral M.I.

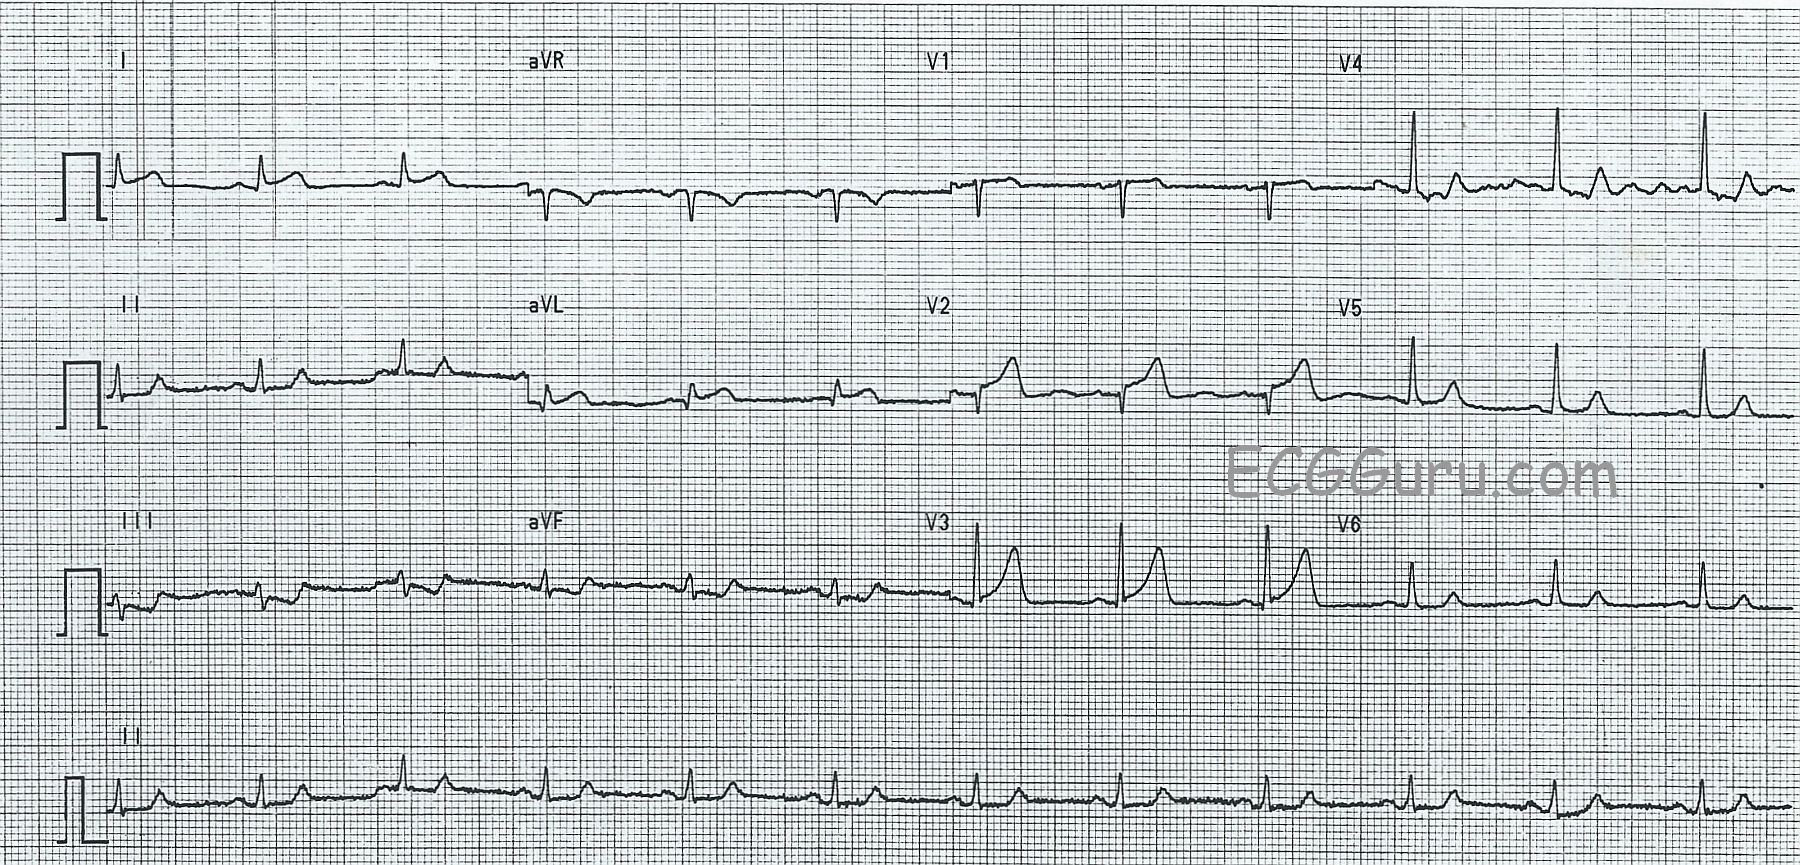
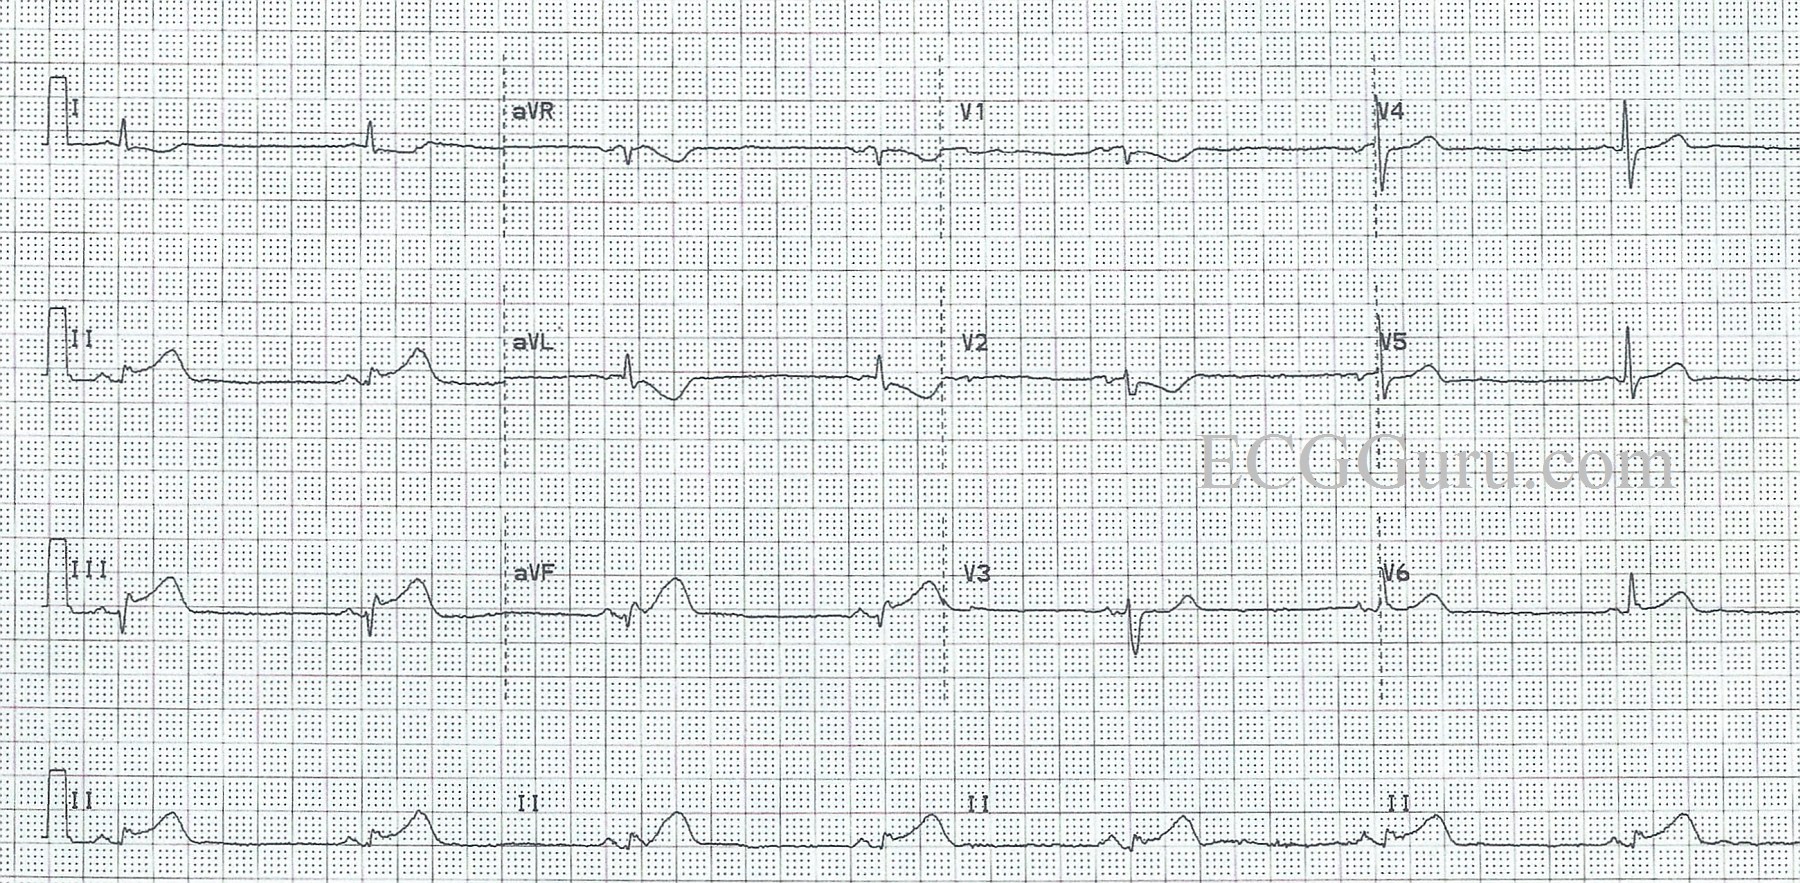
This ECG and rhythm strip are from a 78 year old man with chest pain, but we have no other clinical data. This is a good example of inferior and low lateral injury, demonstrating the large amount of heart muscle that can be damaged when a dominant RCA or circumflex artery is occluded.  The low lateral wall is often included in an inferior wall M.I. when the RCA wraps around the left side of the heart, or the circumflex perfuses the posterior descendng artery and the inferior wall.

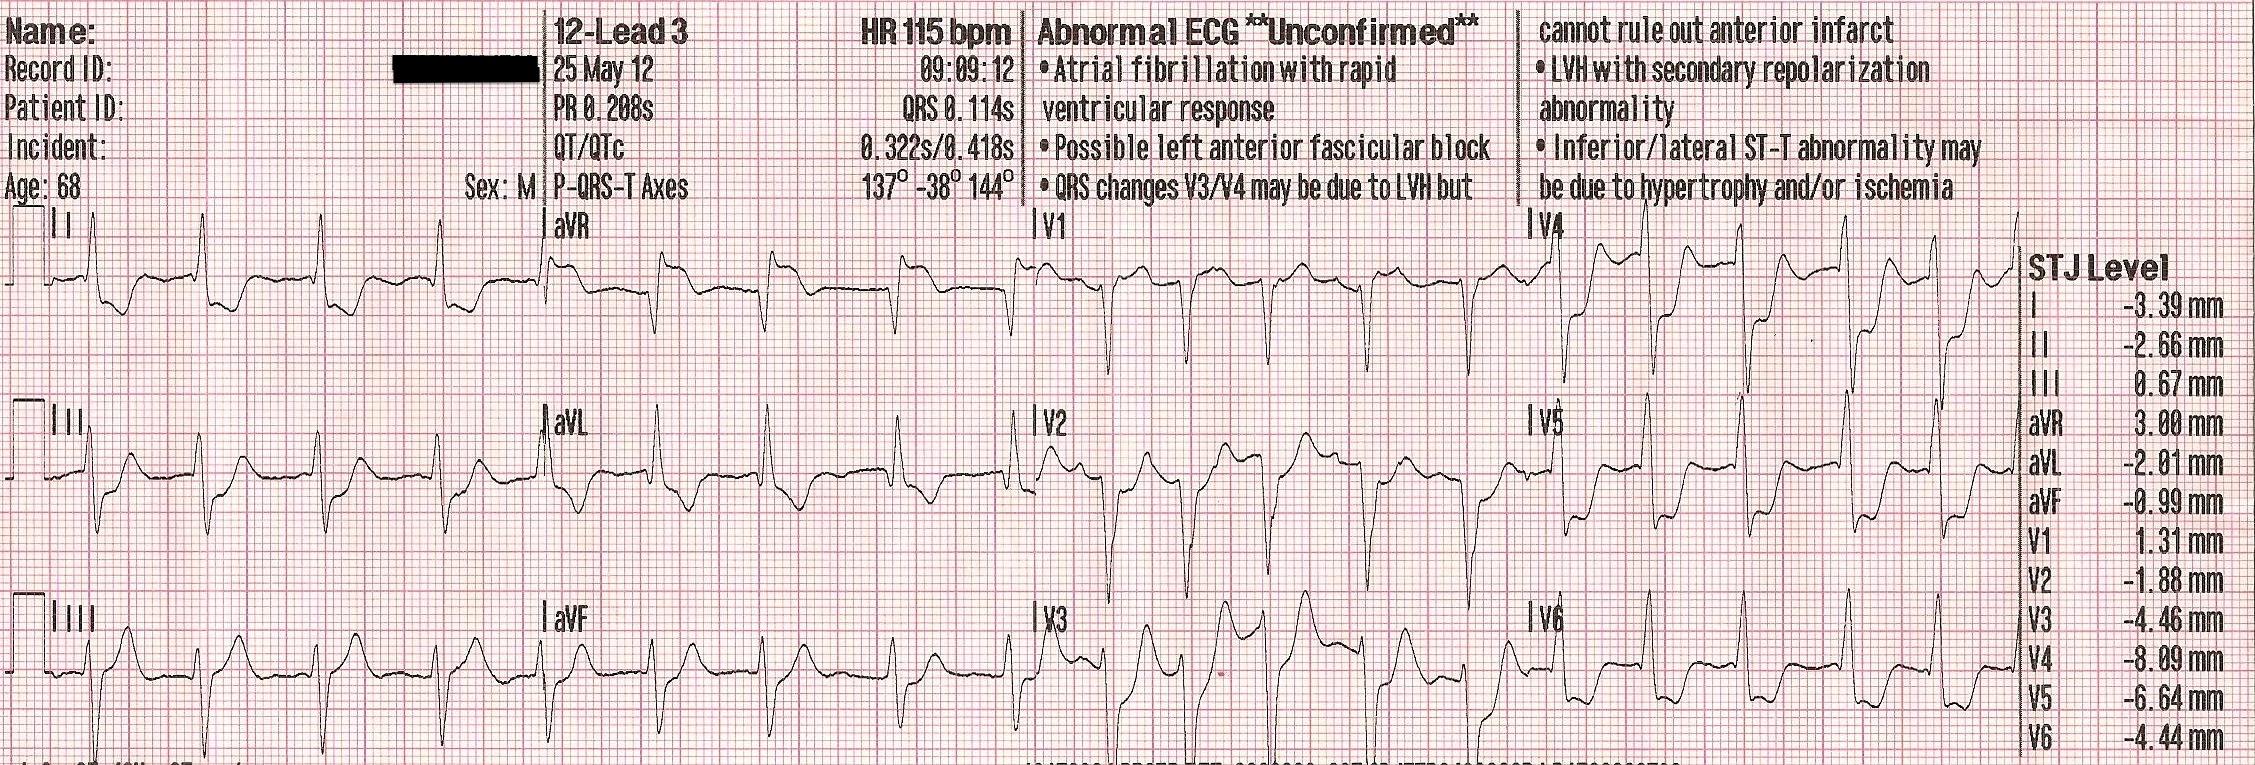
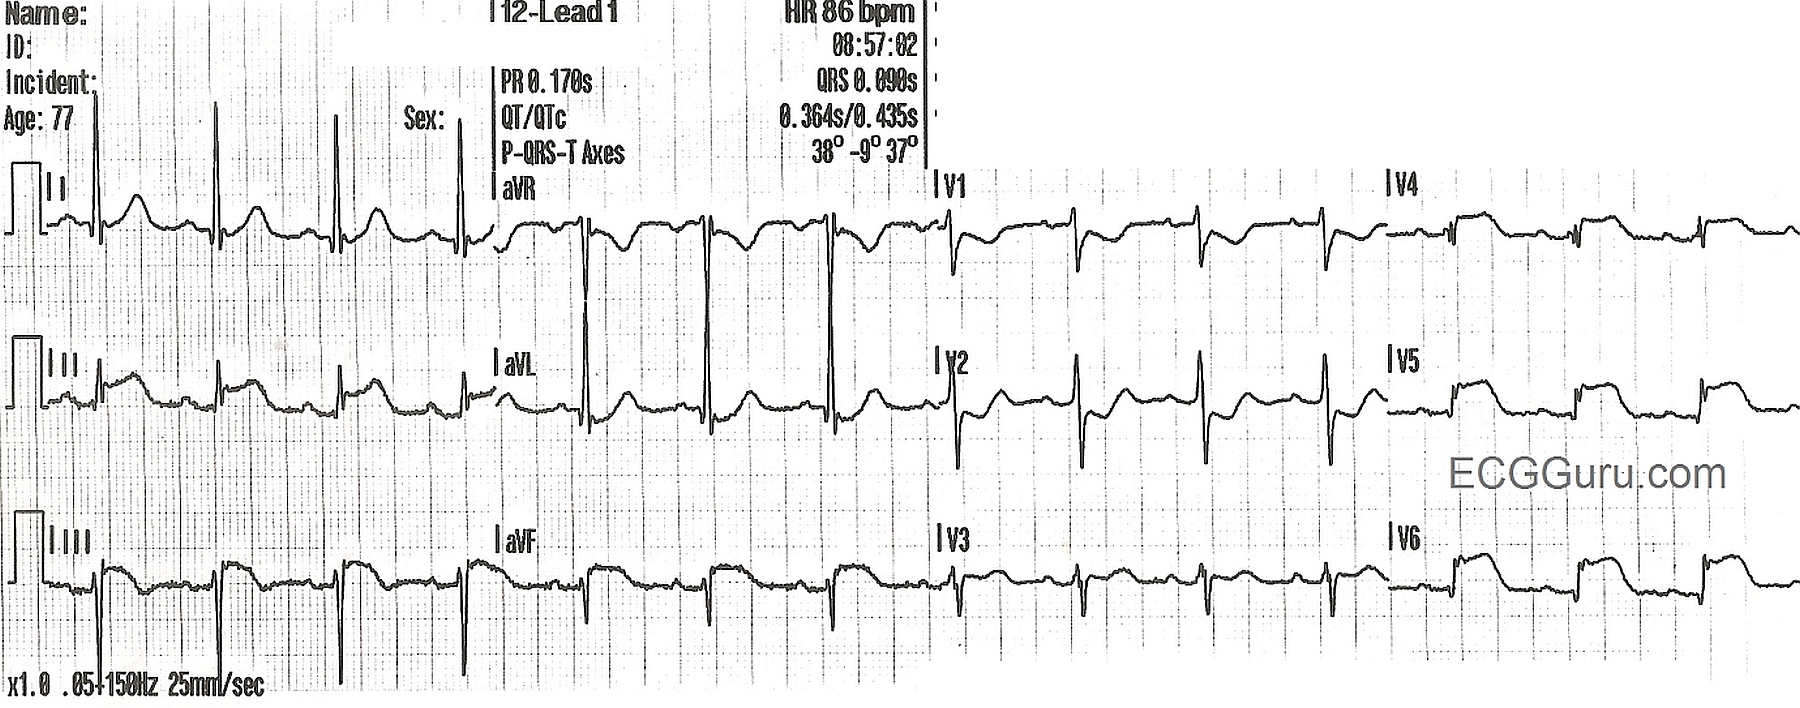
In this ECG, we see a sinus rhythm with obvious ST segment elevation in Leads II, III, and aVF, with reciprocal ST depression n Lead aVL.  There is reciprocal ST depression in V1 and V2, indicating that the inferior wall injury extends up the posterior wall until it is seen by the anterior leads V1 and V2 as ST depression. The term "posterior wall" has come into some scrutiny recently, but it is still commonly used, so we use it here. There is also ST elevation in Leads V4, V5, and V6, reflecting the low lateral wall.  

This is a great example of how the SHAPE of the ST segment is often altered in acute M.I. as well.   Leads II, V4, V5, and V6 have obvious "flattening" of the ST segment. Even when the ST elevation is minimal, this shape is a STRONG indicator of M.I.  Lead III has a convex-upward shape, another giveaway for an M.I. diagnosis.

Adding to the evidence for a diagnosis of acute M.I. are the associated signs:  T wave inversion in Lead III (a sign of ischemia), and poor R wave progression in V3 through V6.  Since V3, V4, V5, and V6 should all have strong R waves, this could be an ominous sign of impending pathological Q waves, a sign of myocardial necrosis.   

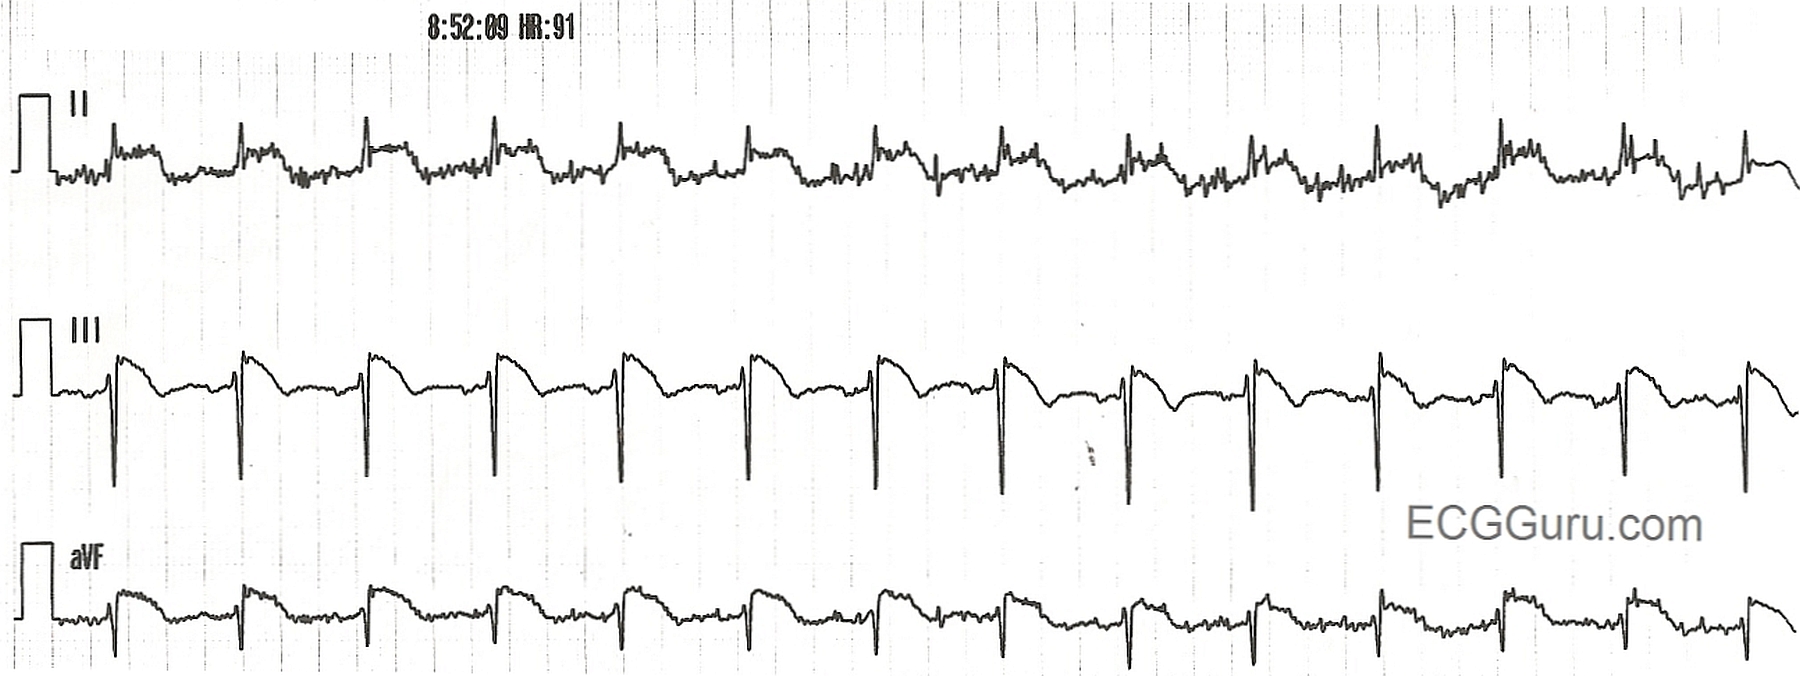
The rhythm strips in this case demonstrate ST elevation also.  There is artifact in Leads II and aVF.   This example can be used for beginners who are learning lead concepts.  Ask, "Which limb is the artifact coming from?"  The answer is the right arm, because Lead III doesn't use the right arm, and it is clear of artifact. 

Dawn's picture

Circumflex Occlusion with Posterior-lateral M.I.

This ECG was obtained from a woman with chest pain who was taken to the cath lab and found to have a 100% occlusion of her circumflex artery.  

There are obvious ST segment elevations in Leads I and aVL, as well as in Lead II.  Lead II is the most leftward of the inferior wall leads, and I and aVL reflect the high lateral wall. She also has ST depressions in V1 through V3.  If you look closely at the R wave progression in the anterior leads, you will readily note that it appears that V1 and V3 wires have been reversed.  That being said, the "real" V2 and V3 have taller-than-normal R waves.  The tall R waves and ST depression are signs of "posterior wall M.I."  Recently, the actual definitions of the "lateral" wall and "posterior" wall have come into question.  However, the important thing clinically, is that this patient IS experiencing an ST elevation M.I. (STEMI), which was confirmed in the cath lab.  The locations of the ST changes were consistent with the 100% occlusion of her circumflex artery.

For our more advanced readers (and our "Gurus"), there is an interesting rhythm.  The P wave morphology changes frequently, even though the rhythm remains regular.  The rate, at 62 BPM, was adequate, and the patient did not suffer any consequential dysrhythmias during her procedure.  We don't have long-term followup information on her.


Dawn's picture

Anterior Wall M.I.

This ECG was taken from a 60 year old man who was complaining of severe substernal chest pain, radiating to his left arm and a non-productive cough.  There was some initial discussion among the EMS crew  about the possibility of the ECG showing a "benign early repolarization" pattern because of the concave upward ("smiling") ST segments.  They also considered a diagnosis of pericarditis, because the ST segments seem widespread.  The baseline artifact makes it difficult to evaluate for PR segment depression or Spodick's Sign.

The patient's age (60 years) and troubling symptoms (chest pain radiating to the left arm) ruled out BEP for the paramedics.  The ST segment elevations are pretty widespread - Leads V3, V4, V5, V6, I and II all show some STE.  There are also "hyperacute" T waves in the leads with STE.  There are ST abnormalities ranging from flattening of the shape to depression, but the bottom line is this patient is a 60-year-old man with substernal chest pain radiating down his left arm!

The patient was treated in the ambulance with chest pain protocols, and was transferred to a hospital with an interventional cath lab.  The patient was conculusively diagnosed with an acute M.I. and underwent angioplasty.

This is a good ECG to demonstrate subtle changes when, combined with patient presentation, can help us diagnose a coronary event.  It helps us emphasize that not all STEMIs will have dome-shaped, "tombstone" ST segments, and that patient symptoms, history, and age are important to consider.

Pages

All our content is FREE & COPYRIGHT FREE for non-commercial use

Please be courteous and leave any watermark or author attribution on content you reproduce.