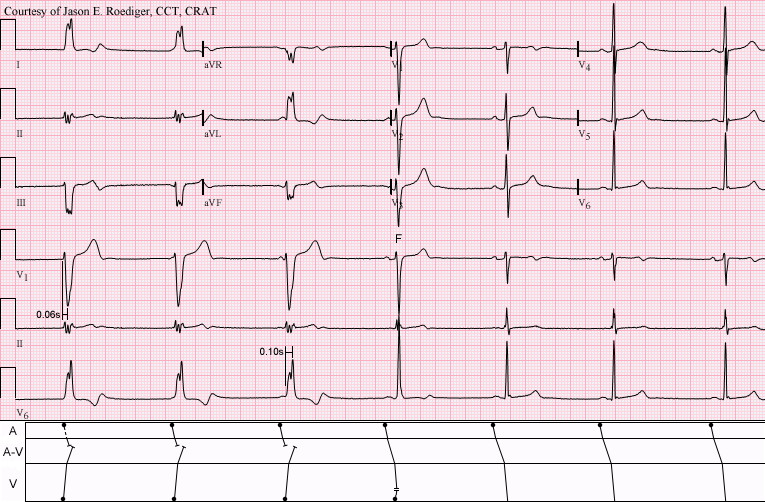
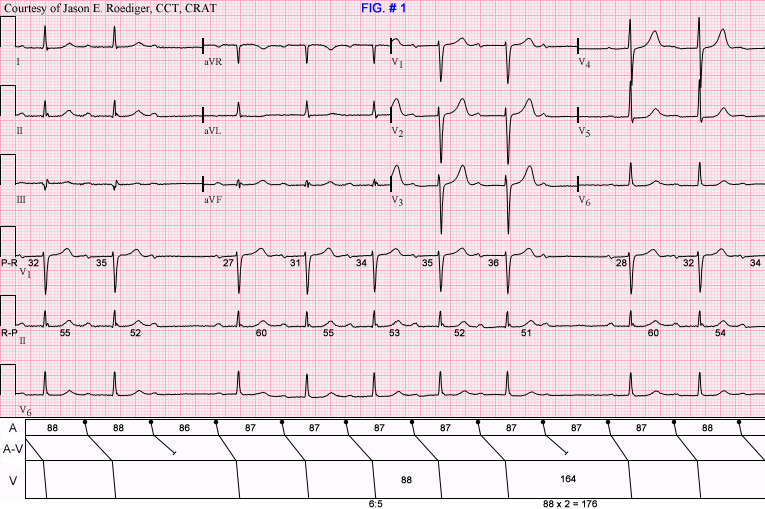
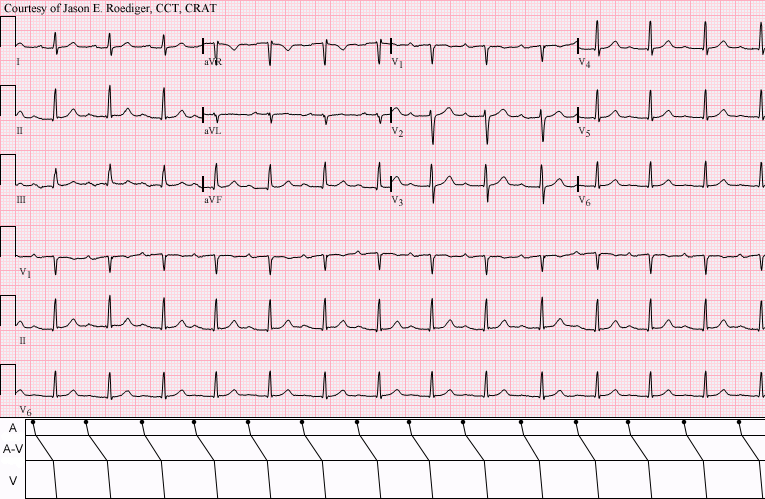
This is one of five consecutive serial ECGs that I performed several years ago on a patient in our Outpatient ECG Lab. The patient was asymptomatic and the ECG was ordered as "Routine" by the patient's Primary Care Provider (PCP). I deliberately "froze" the tracing on the screen and captured this image because I wanted to show a transition on the ECG.
No clinical patient data available.
What does this tracing show? Choose the correct answer from the list below.
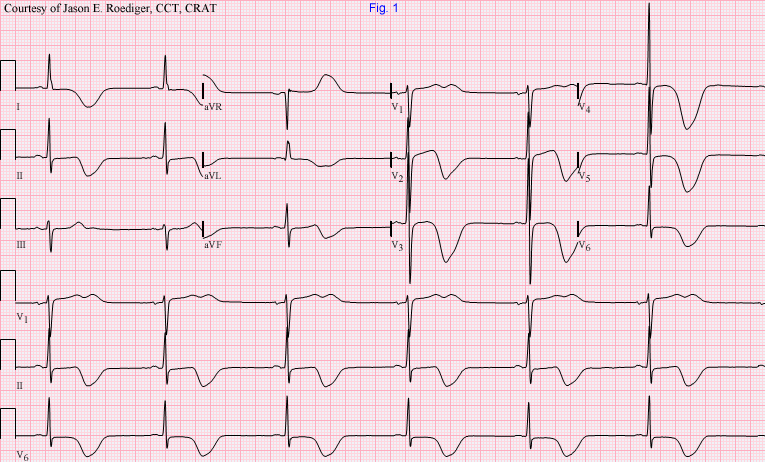
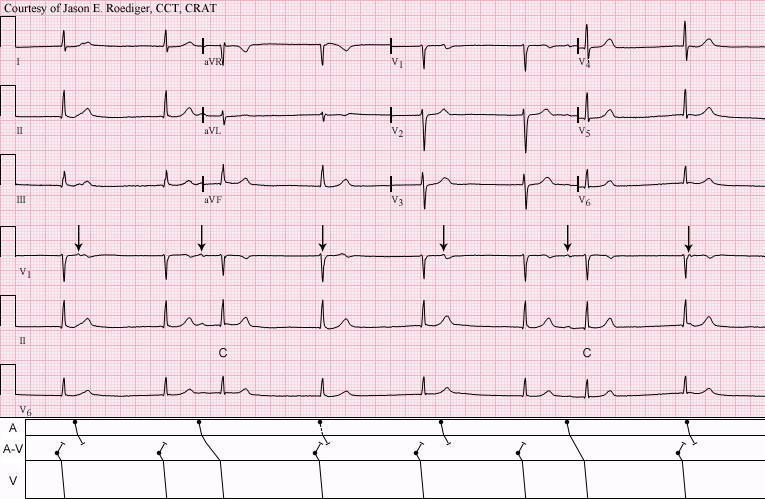
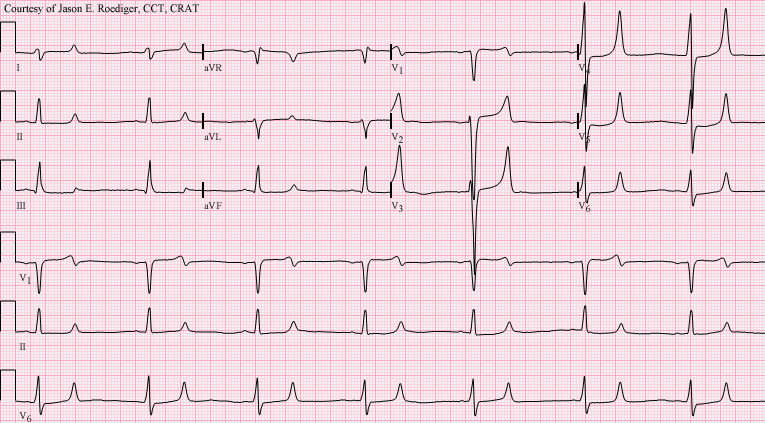
Inferior wall MI: ST elevation in II, III, and aVF. Reciprocal ST depressions. Sinus bradycardia and first-degree AV block suggests sinus node and AV node ischemia. This is a good "classic" inferior wall M.I. It is good for teaching inferior-posterior injury, and the effects of RCA occlusion on the sinus and AV nodes. The low voltage in the limb leads may also be due to acute M.I., but in this case, we do not know the patient's body size.
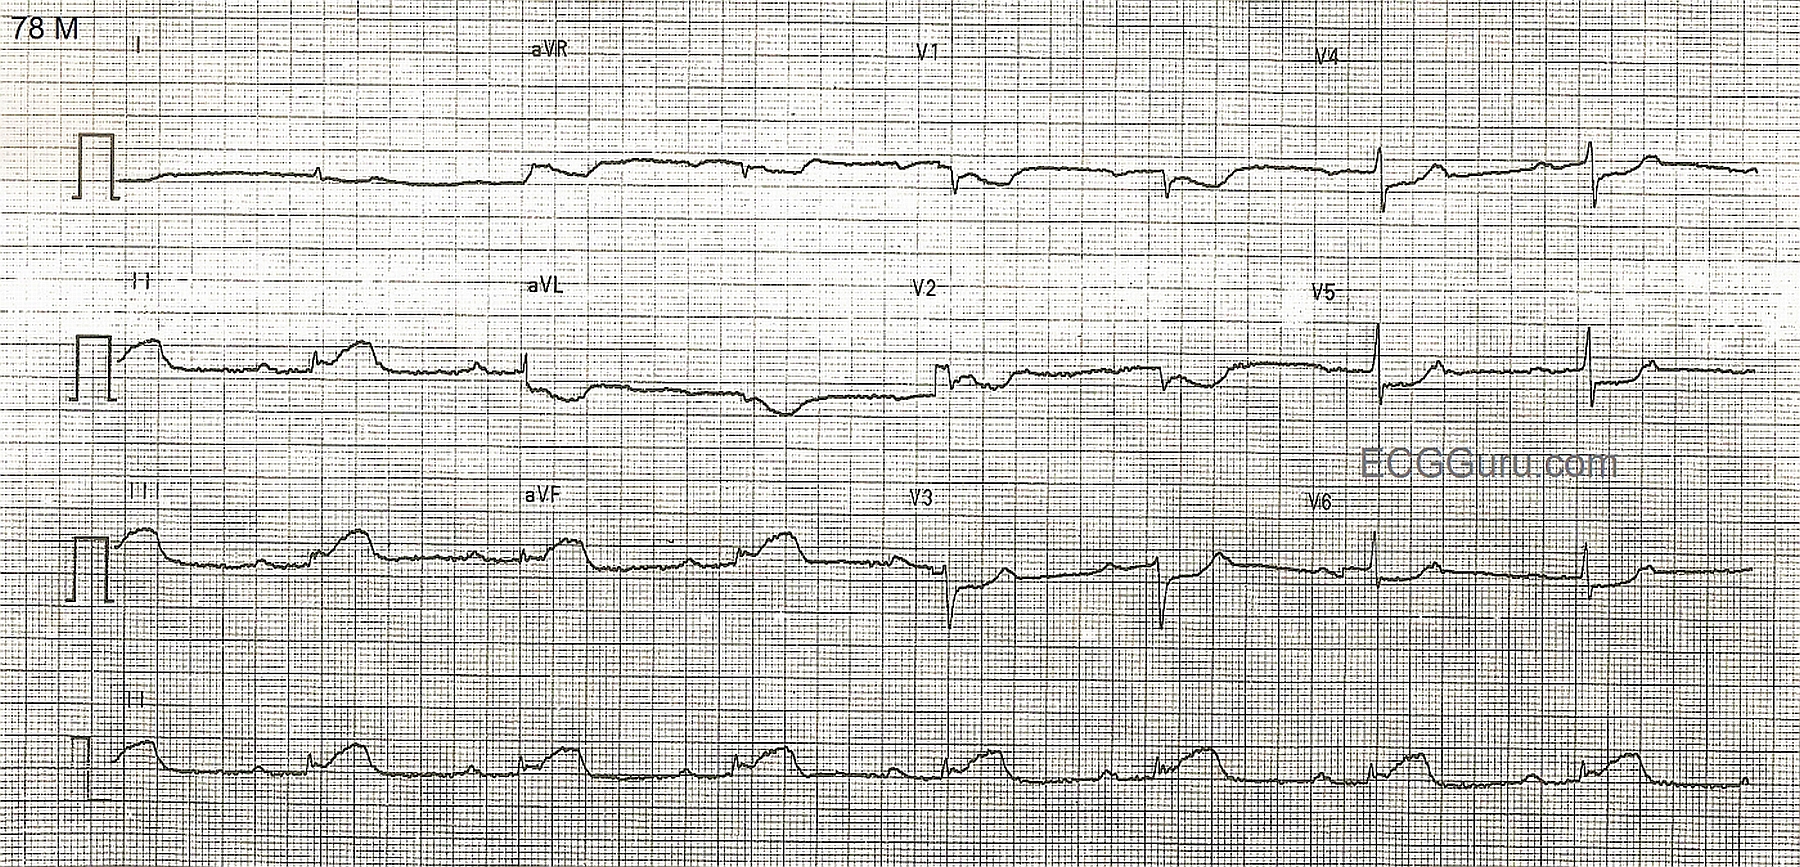
This patient was seen by his primary care provider (PCP) on an outpatient basis. The PCP decided to send her patient over to me to perform a routine ECG and establish a baseline, hince the computer's statement below of "No previous ECGs available". I printed out the above 12-lead ECG and became slightly concerned with the rhythm I was seeing. Consequently, I also recorded six full pages of continuous rhythm (not shown here). I don’t ordinarily resort to doing this except on those rare
This ECG shows a classic inferior - posterior STEMI. This M.I. was due to complete occlusion of the right coronary artery. ST elevation apparent in Leads II, III, and aVF show the acute injury in the inferior wall, while ST depressions in V1 and V2 are reciprocal of the ST elevations in the posterior wall. The tall R waves in Leads V1 - V3 most likely are reciprocal to pathological Q waves in the posterior wall. Tall R waves in the right precordial leads can be caused by other cardiac conditions, such as right ventricular enlargement. RV hypertrophy can probably be ruled out in this case because there is no right axis deviation or P pulmonale. Because inferior wall M.I.s often extend into the posterior wall, it is the most likely cause of the tall R waves.