Displaying 11 - 20 of 83
Dawn's picture

Lateral Wall M.I.

The patient:   This ECG was taken from a 66-year-old man who was complaining of chest pain at rest. He had been previously diagnosed with lung cancer with metastases to his bones.  The last ECG, taken one week ago, was normal.

The ECG:  There is mild sinus tachycardia at 101 bpm.  The rhythm is regular.  The QRS duration and PR interval are normal, as is the QTc.  The QRS voltage in the limb leads is small, and we do not know the patient’s height and weight.

There are notable ST elevations in I and aVL (high lateral wall) and in V5 and V6 (low lateral wall).  When the high and low lateral walls are similarly affected, we usually look to the circumflex artery as the culprit artery.  We also see ST depression in Leads III and aVF (reciprocal to the STE in I and aVL) and in V1 – V4.  This could indicate subendocardial damage or reciprocal changes.  This ECG meets the criteria for acute lateral myocardial infarction.

The patient was taken to the cath lab emergently.  His coronary arteries, including the left circumflex, all were free of occlusive lesions.  He had no coronary spasm during the procedure, but it was decided that spasm had been the cause of the ECG changes.  His ECG reverted to normal.

It is important to record abnormal findings, as some changes can be temporary or fleeting.  Coronary artery spasm can cause ischemia and damage to the heart, just as plaque lesions and blood clots can.

Dawn's picture

Inferior-posterior Wall M.I. and AV Dissociation

At the ECG Guru website, our main goal is to provide quality teaching materials to those who teach ECG interpretation and other cardiac topics.  This ECG offers teaching opportunities for those who teach any level of student.

The patient:   This ECG was obtained in the Emergency Department from a 54-year-old man who was complaining of severe chest pain and nausea.  His BP was 130/68.

Dawn's picture

Onset of Pathological Q Waves

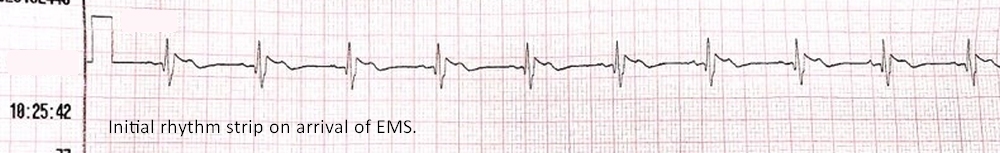
 The Patient:     44-year-old man with chest pain.  Symptoms started over 24 hours ago. The EMS crew recognized an acute M.I. on the ECG and transferred him immediately to a cardiac hospital. They started two I.V.s and gave aspirin enroute. 


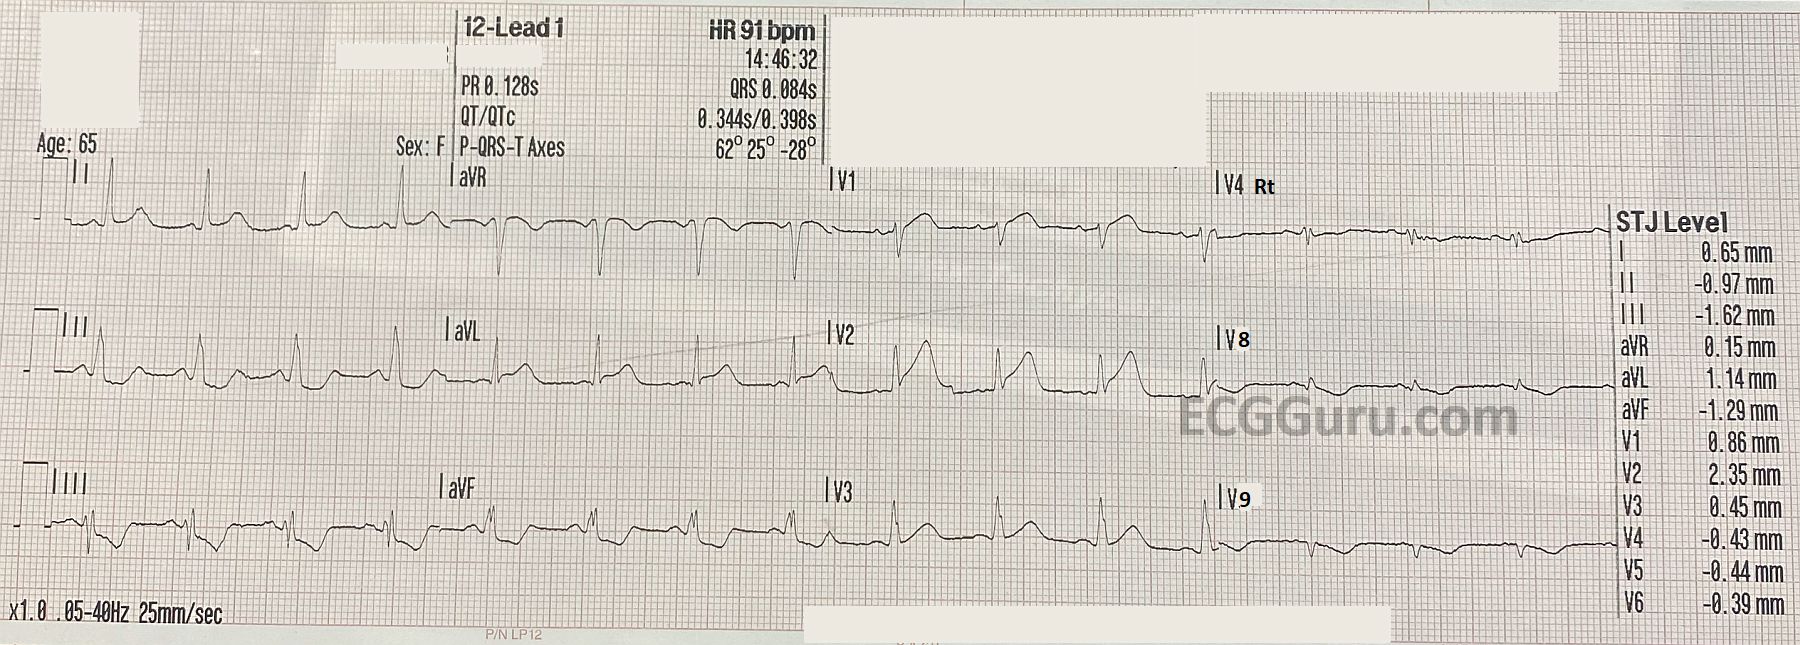
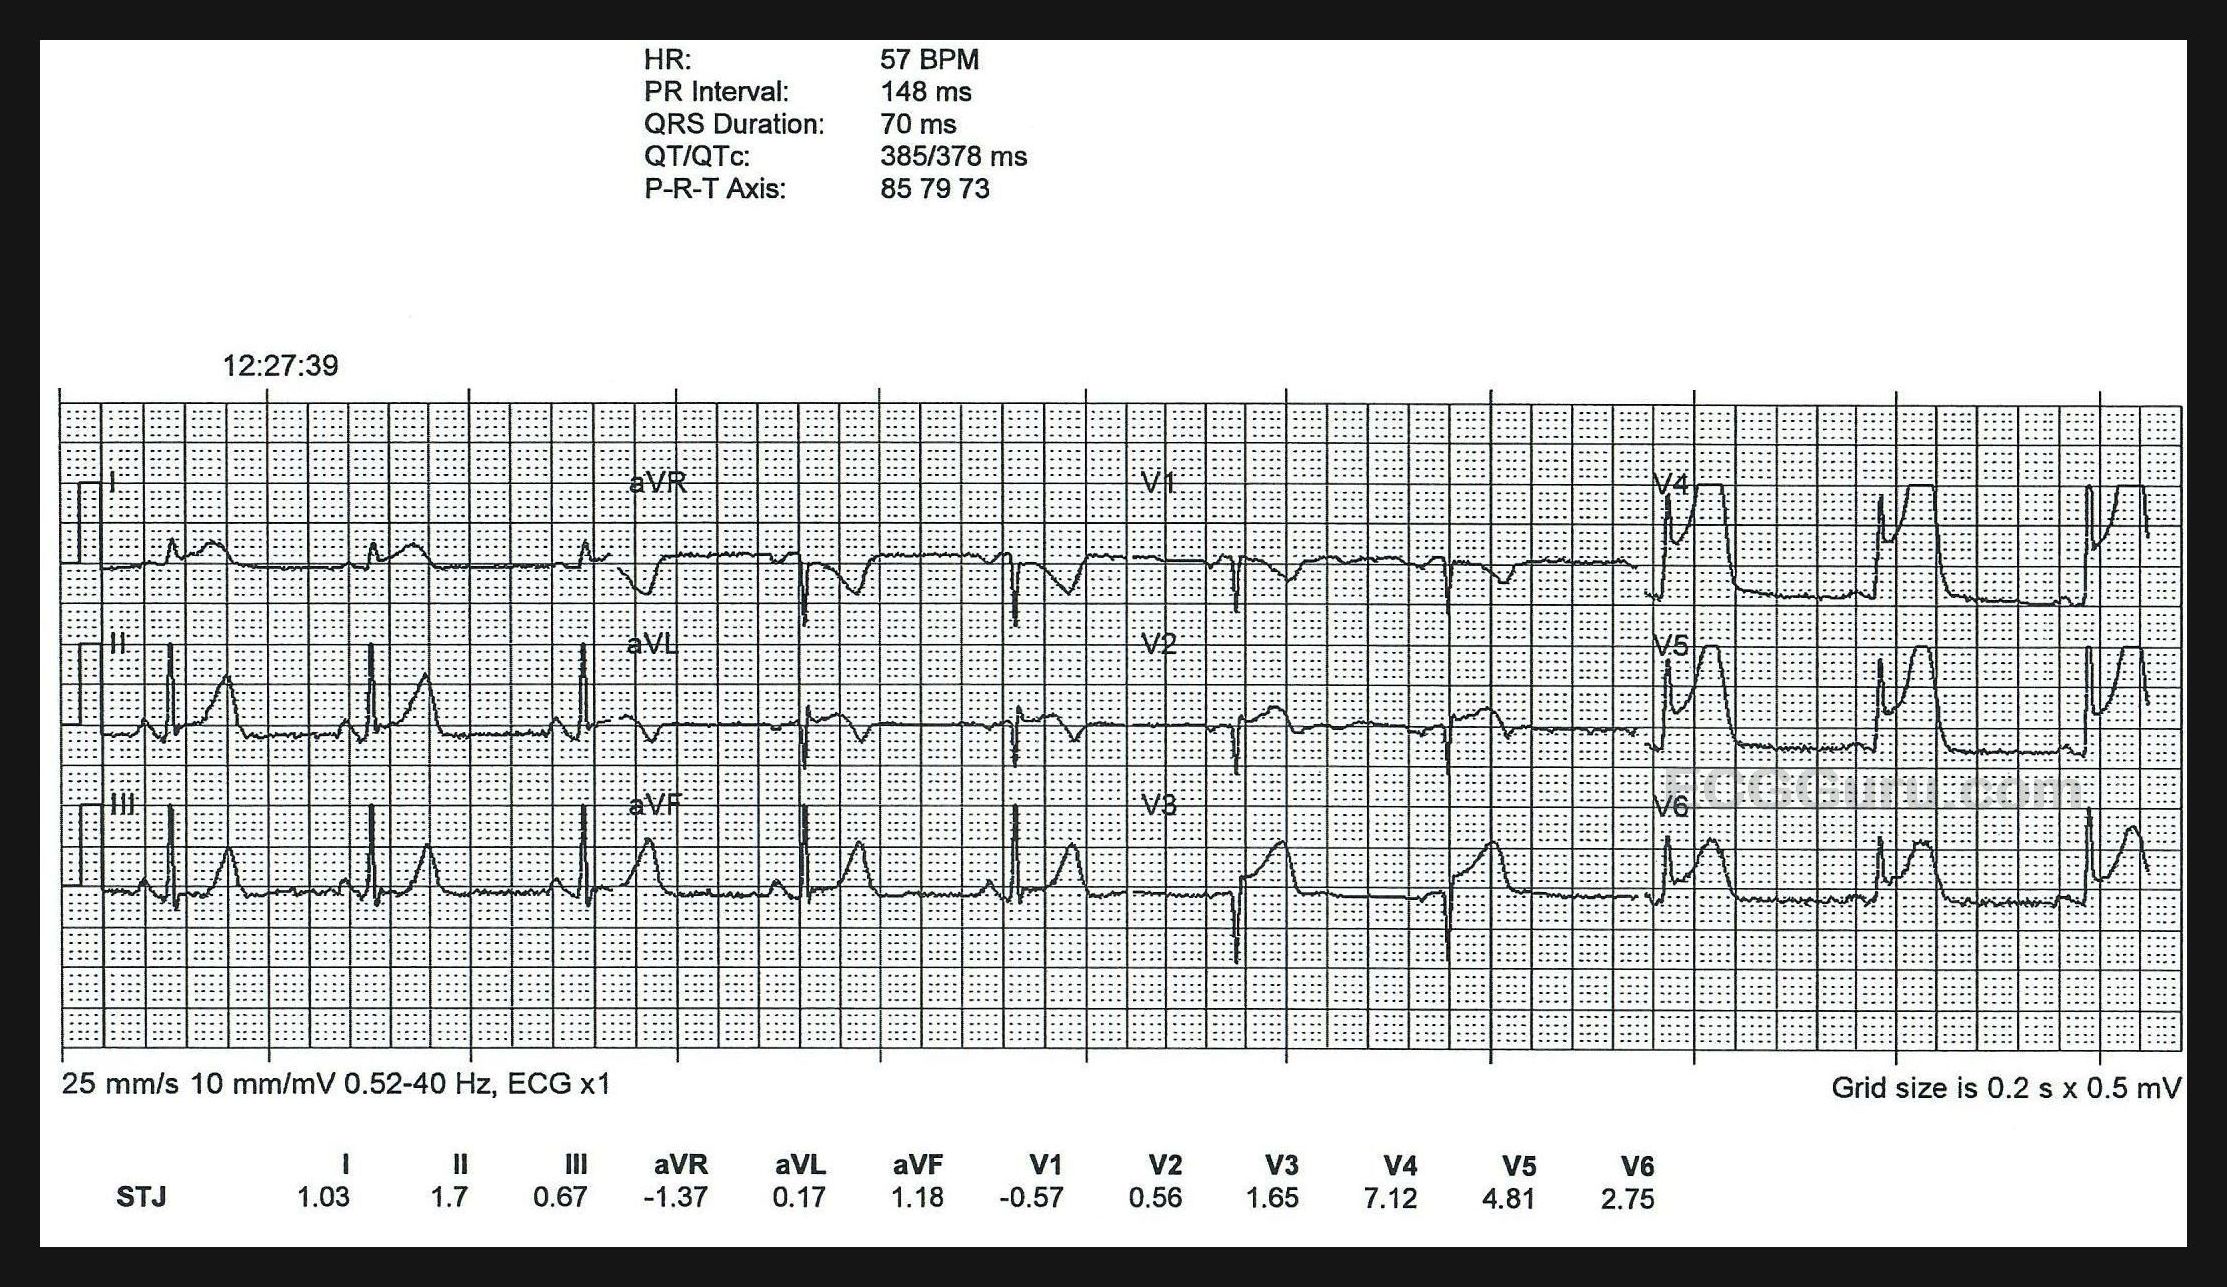
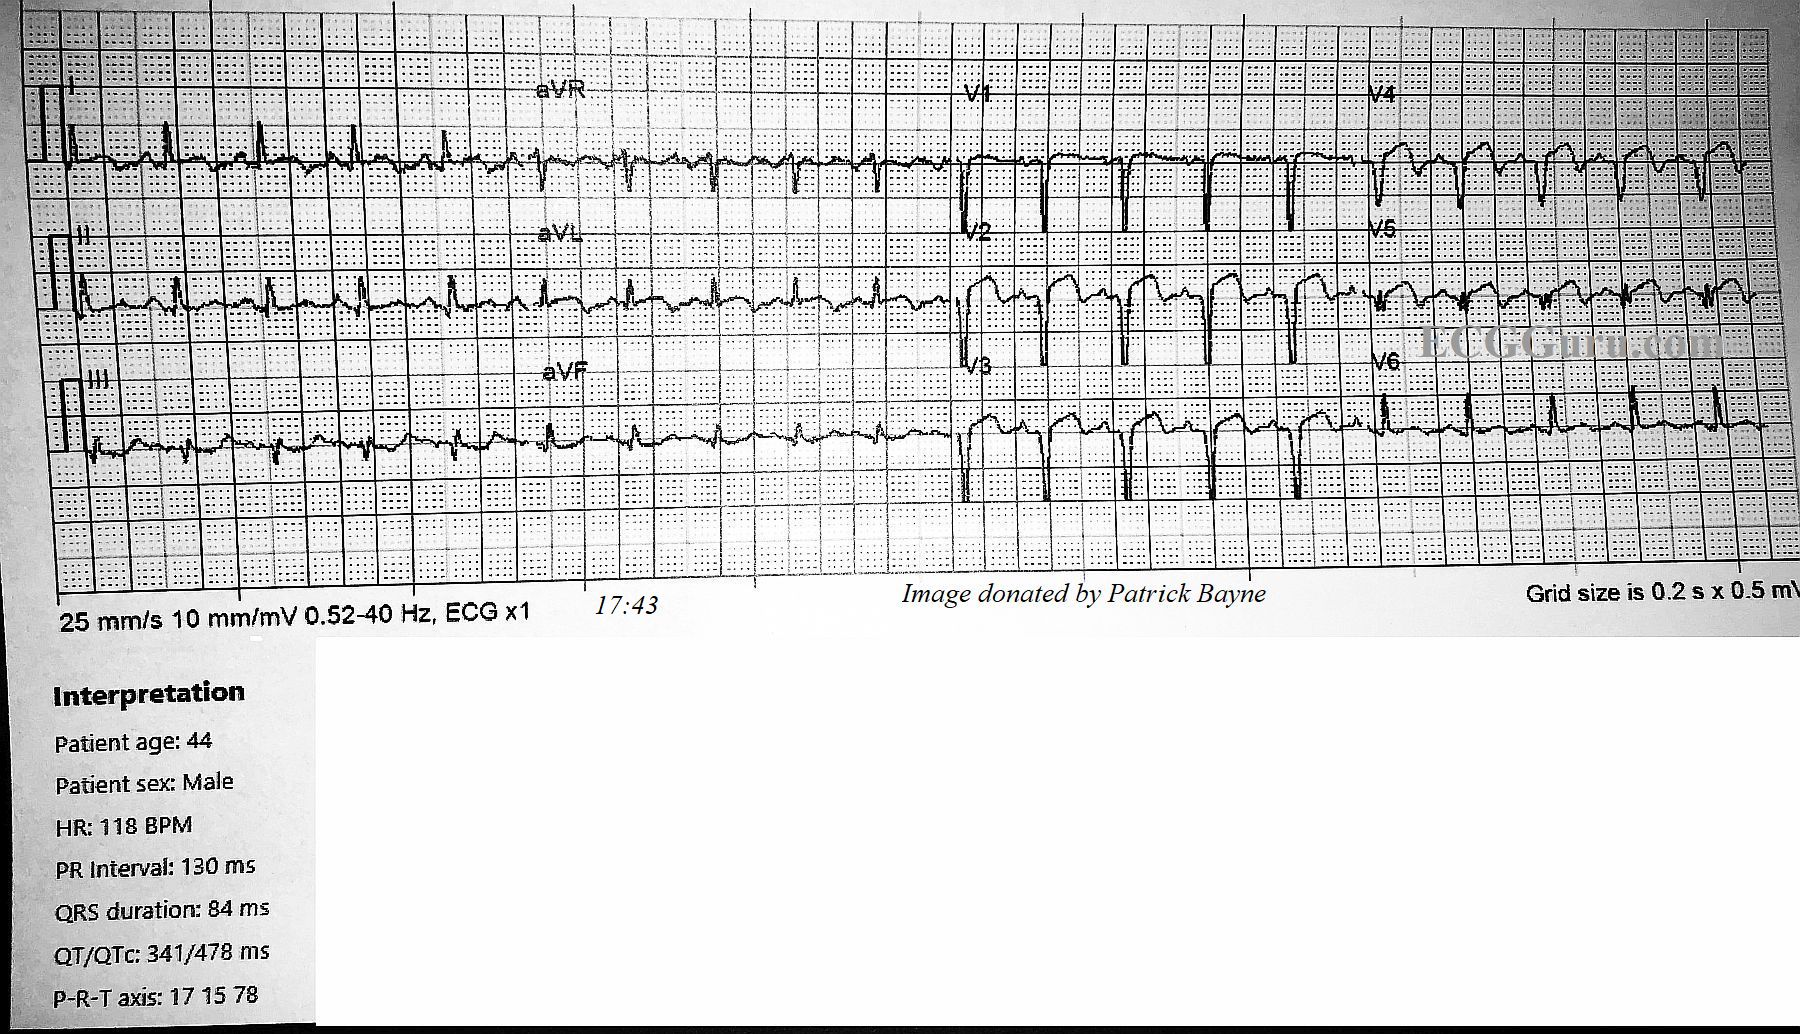
ECG No. 1 @17:43:    The rhythm is sinus tachycardia at 118 bpm.  The PR interval is within normal limits at 130 ms, and the QRS is narrow at 84 ms.  The QTCc is 478 ms by the machine’s measurement, but we measured the QT at 303 ms and QTc as 376-419 ms via various methods, which are within normal limits. The QRS frontal plane axis is at 15 degrees, within normal limits.

The ST segments are elevated and mostly straight in Leads V1 through V5, I and aVL. There is mild ST depression in III and aVF.  Very concerning are the pathological Q waves in V1 through V5, indicating loss (death) of myocardial tissue in the anterior wall. 

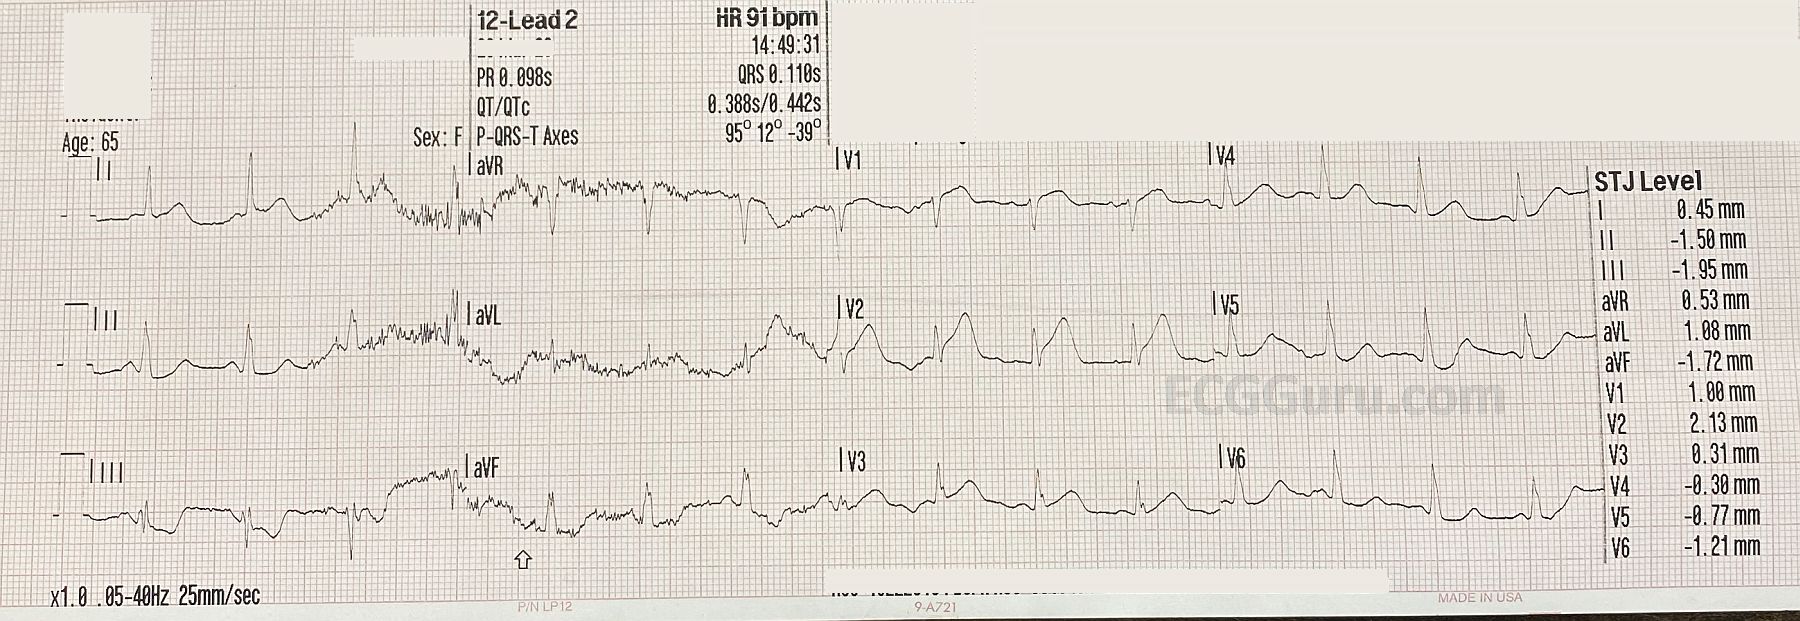
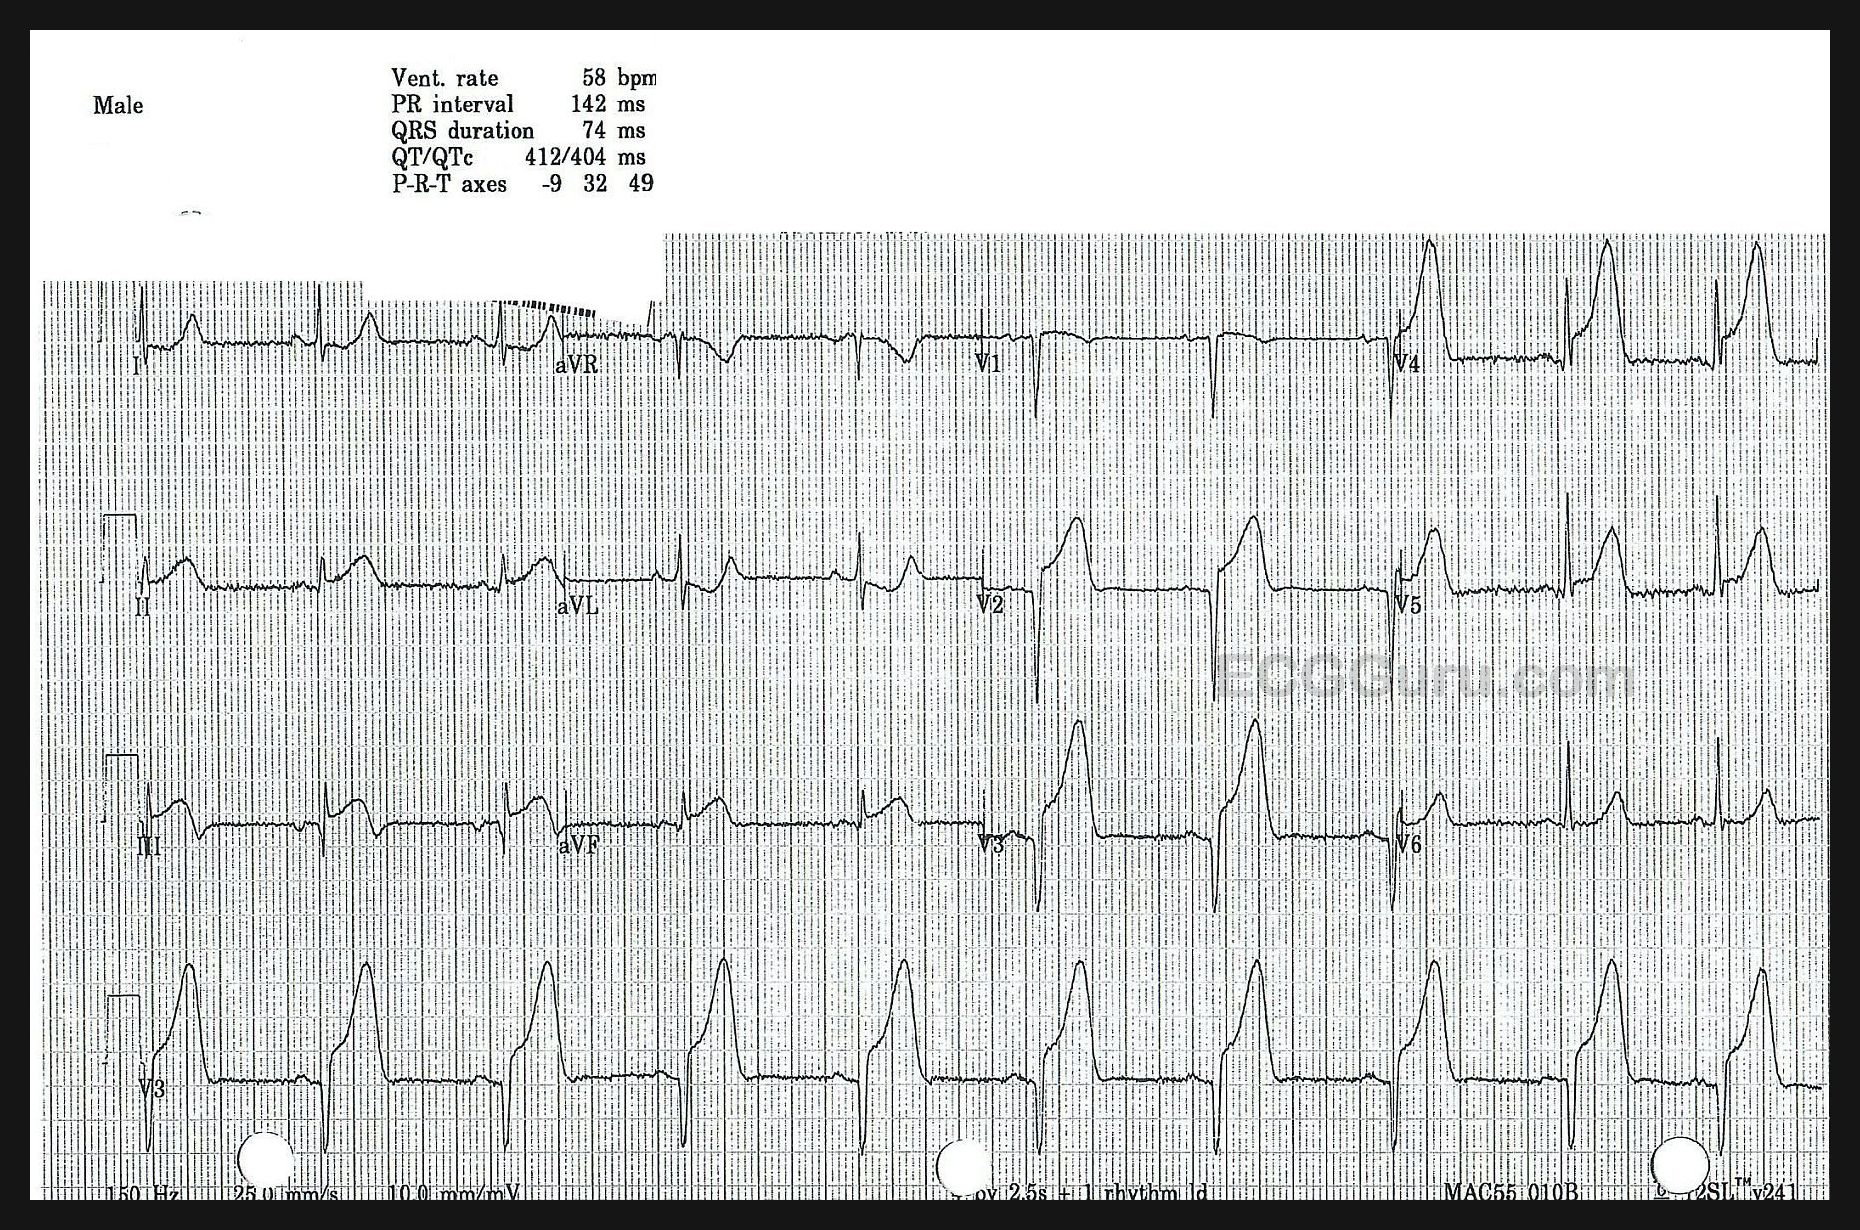
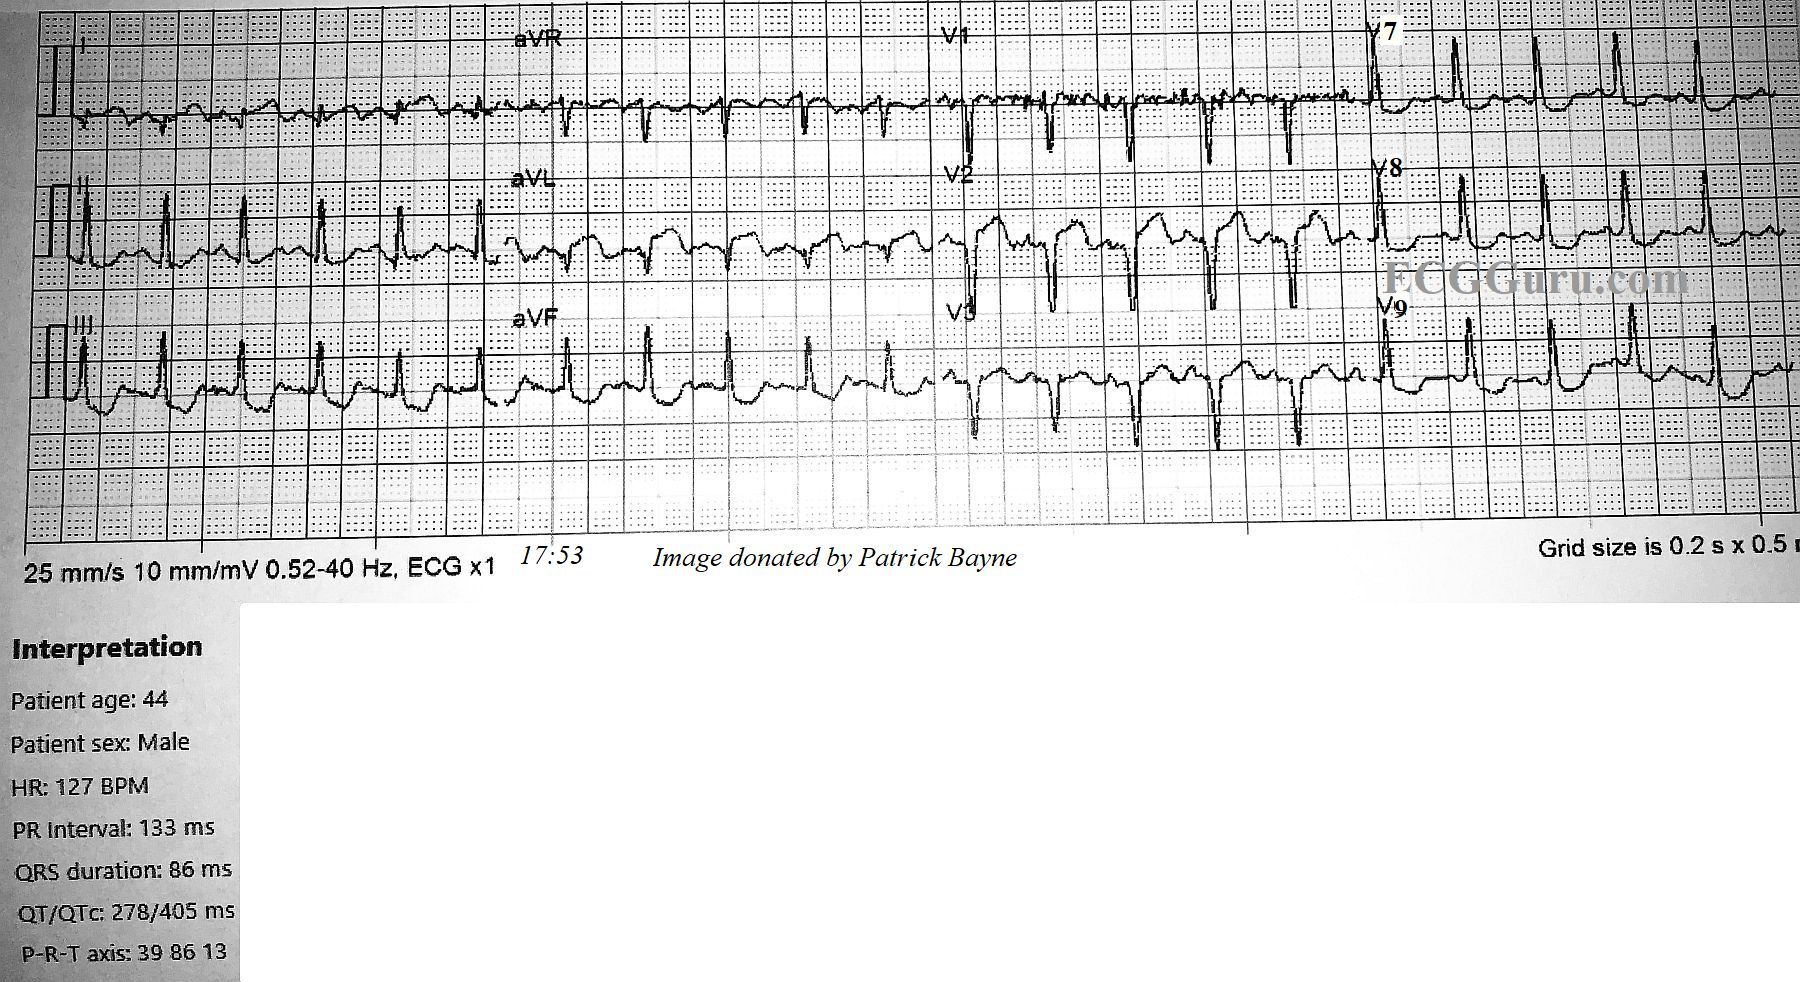
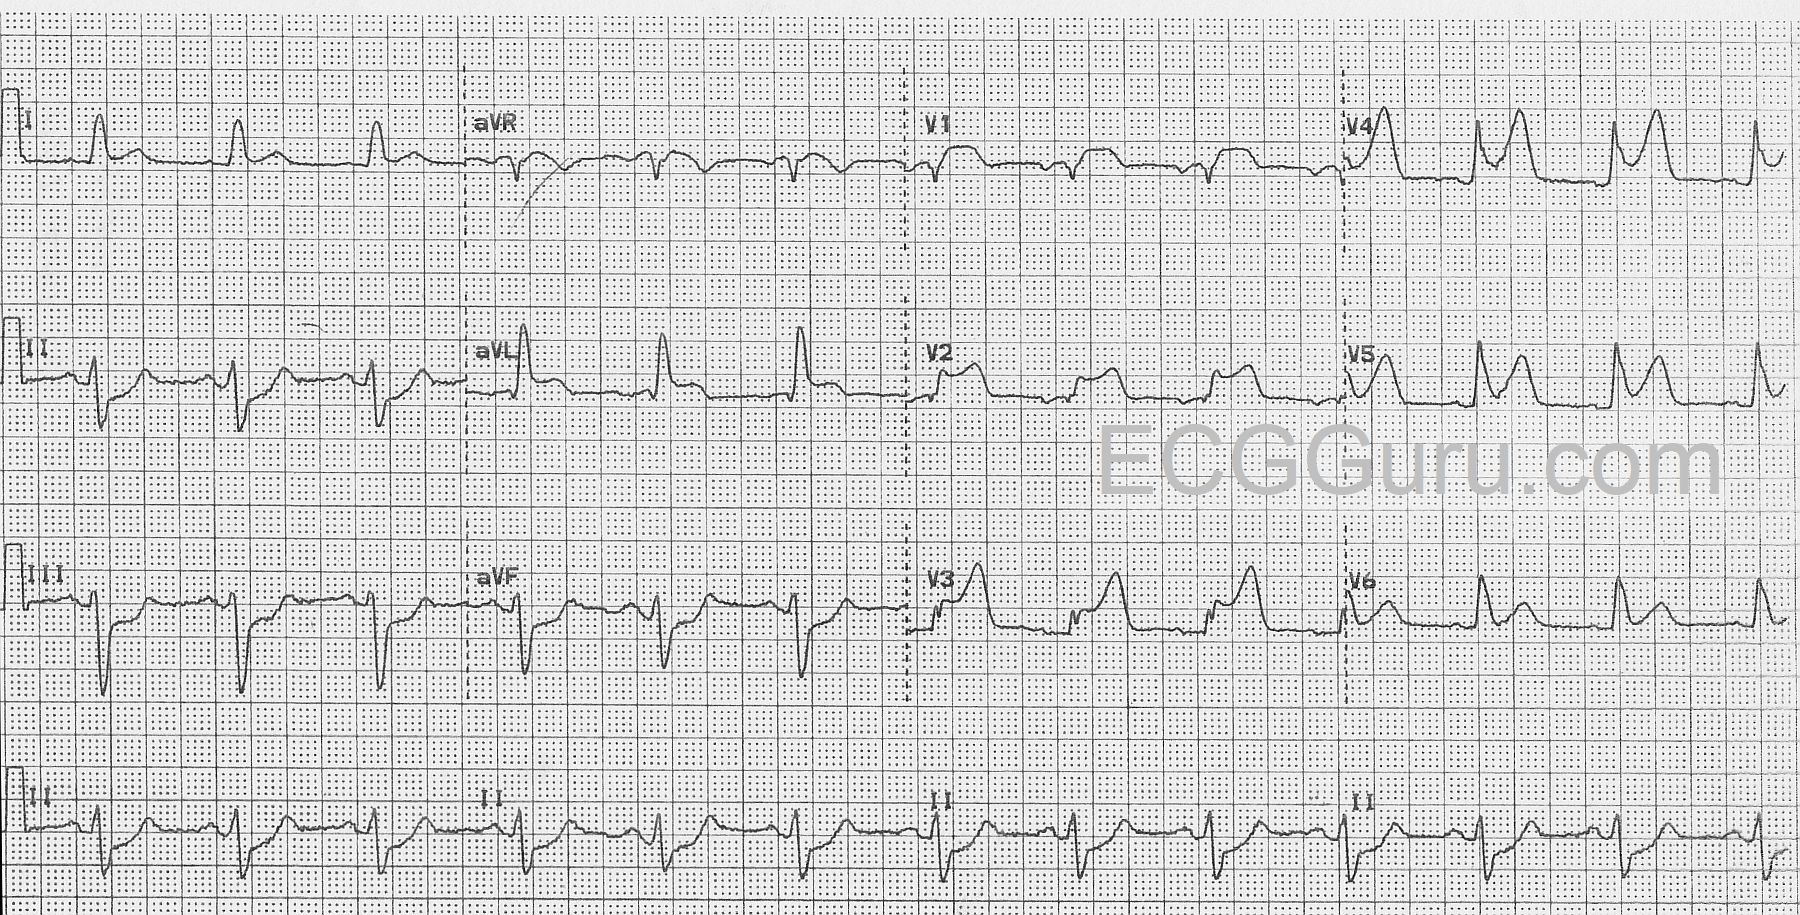
ECG No. 2 @ 17:53:  The second ECG was performed about 10 minutes later, and V4, V5, and V6 were replaced by V7, V8, and V9.  Reciprocal ST depression is observed in those additional leads. The heart rate is now 128 bpm.  It is notable that pathological Q waves have now appeared in Leads I and aVL. There has been no change in lead placement.  The onset of necrosis in the high lateral wall has shifted the frontal plane axis toward the right extreme of normal, at 86 degrees, and now II, III, and aVF have prominent R waves. Another cause for right axis shift in anterior wall M.I. to consider would be posterior hemiblock. However, that is a diagnosis of exclusion, and the new Q waves explain the axis shift.  It is interesting that the onset of pathological Q waves was captured in these serial ECGs.

Dawn's picture

Shark Fin Pattern

The Patient:  This ECG is from a 59-year-old woman who was found by the EMS crew to be unresponsive, with agonal respirations at about 6 breaths per minute. Her pulse was thready at the carotid, and absent peripherally. Her skin was pale, cool, and mottled.  Her BP via the monitor is 81/40, peripheral pulses not being palpable.  An initial rhythm strip showed sinus rhythm at 75 bpm with right bundle branch block and ST elevation.

The patient’s husband gave a history of “difficulty breathing” since sometime this morning, alcohol dependence, hypertension, tobacco use, and insomnia. He said she had been drinking heavily for several weeks.

She was immediately ventilated and intubated, and an intraosseous infusion line established.  A12-lead ECG was done, and it showed a dramatic change in the rhythm and ST segments over the initial strip. She was transported to a nearby hospital with CPR support. She achieved return of spontaneous circulation (ROSC) at the Emergency Department, after having three doses of epinephrine.  Follow up with the ED physician revealed that the patient had suffered a massive gastrointestinal bleed.  This patient, due to loss of a critical amount of blood, had low blood pressure and very poor perfusion, which resulted in damage to her heart (and possibly other organs as well). I do not have further follow up, but will update this if I receive more information. 

Dawn's picture

Anterior-lateral M.I. With Wide QRS

The Patient:  An elderly man presents with chest pain, pallor, diaphoresis and weakness.

The ECG:     The rhythm is normal sinus at a rate of about 76 bpm with normal intervals. The QRS complexes are wide at about .14 seconds (140 ms).  There is ST segment elevation in all precordial leads, except for possibly V6.  The shape of the ST segments in the anterior wall range from coved upward in a “frowning” shape (V1) to very straight (V5 and V6).  There is also ST elevation in aVL with ST straightening in Lead I.  There is ST depression in the inferior leads, II, III, and aVF.  Lead II is equally biphasic while I and aVL are positive, indicating an axis that is shifted slightly to the left.  With his symptoms and this alarming ECG, he was sent promptly to the cath lab.

Interpretation:  The rather obvious ST-elevation M.I. is extensive, covering the entire anterior wall, and extending into the high and low lateral walls . This was confirmed in the cath lab, as the patient had an occlusion of the left anterior descending artery near the bifurcation of the circumflex.  The wide QRS meets the criteria for left bundle branch block (wide QRS, negative QRS in V1 and positive QRS in V6 and Lead I).  However, it doesn’t have the “look” of LBBB with the low-voltage seen in the anterior wall. After the offending artery was opened and stented, the wide complex became narrow and was considered to be an interventricular conduction delay that was due to the ischemia.  The ST depression in the inferior wall is most likely reciprocal.

Dawn's picture

Inferior Wall M.I. With Atrial Fibrillation

The Patient   This ECG was obtained from a 74-year-old man who had a history of COPD. He was complaining of severe chest pain at the time of the ECG.

The ECG     The rhythm is atrial fib or flutter (the R to R intervals are irregular, but seem to repeat about 4 interals).  Flutter waves are seen during some of the longer intervals. The rate is approximately 90 beats per minute.  The ST segments are very noticeably elevated in Leads II, III, and aVF.  There is reciprocal ST depression in Leads I and aVL, and also in all the precordial leads. 

Dawn's picture

Anterior Wall M.I. With Ventricular Bigeminy

The Patient     This ECG was obtained from a 51-year-old man who presented to EMS with acute chest pain. He had a history of hypertension, 40 pack-year smoker.

Hospital Course     He was diagnosed with anterior wall STEMI and taken to the cath lab.  He was rated Killips Class 1 (no evidence of congestive heart failure), TIMI risk score 4  (14% risk of all-cause 30-day mortality).  He underwent primary percutaneous coronary intervention (PCI) of the proximal left anterior descending coronary artery (LAD).

Ten days post PCI, the patient had ventricular arrhythmias and went into cardiac arrest, but was resuscitated. He continued to have occurrences of non-sustained ventricular tachycardia (VT), progressing to sustained VT.  Electrolytes were monitored and corrected when necessary. The patient expired before any further diagnosis was made.

ECG Interpretation    The rhythm is sinus at a rate of about 80 bpm (first two beats).  The PR interval is about .18 seconds.  The QRS duration is about .10 seconds.  After the second sinus beat, ventricular bigeminy occurs. Every other sinus beat is obscured by the PVCs.  By the end of the strip, the underlying sinus rhythm has slowed slightly.

The ECG signs that the ectopic beats are ventricular are:  lack of P waves associated with the premature beats, QRS width about .16 seconds, and compensatory pauses.  The axis of the sinus beats is around 60 degrees (normal), but the axis of the premature beats is difficult to determine due to the low voltage and biphasic QRS complexes in the frontal plane leads.  It is also difficult to determine ST and T wave changes in the PVCs for the same reason.

Dawn's picture

Catastrophic Event With Bradycardia

The Patient:    Paramedics were summoned to the home of a 74-year-old woman who had a complaint of shortness of breath.  She was found sitting, alert and oriented, with labored respirations at 30/min. She stated that the shortness of breath came on suddenly. She denied any cardiac or pulmonary medical history, and said she took no medications. The patient was ambulatory.  Her skin was cool and moist.  Her SpO2 on room air was 85%, improving to 90% on oxygen via 15 lpm non-rebreather mask.  Her lungs sounded clear.


When the patient was moved to the transport vehicle, she suddenly became nonverbal, with a leftward gaze. Her pupils were noted to be unequal and non-reactive (we do not know which was larger).  Her BP was 67/43.


During transport, her heart rate declined into the 20’s and became apneic and pulseless.  Recorded BP was 46/25. CPR was done until and after arrival at the hospital, where efforts to resuscitate were halted after some time.


Dawn's picture

Myocardial Infarction With Non-obstructive Coronary Arteries

This ECG was obtained from a 37-year-old male who was complaining of non-radiating substernal chest pain.  He offered no significant medical history.  He denied taking any medications.  He was hypertensive and bradycardic on arrival in the Emergency Dept. He was alert and ambulatory.  Approximately 20 minutes after first being seen by paramedics, he suffered an episode of ventricular fibrillation in the E.D.  He was resuscitated and sent to the cath lab.  His coronary arteries were without lesions.  We do not know the results of any lab tests, including troponins.

What does the ECG show?  The rhythm is sinus bradycardia at a rate of 48 bpm. The PR, QTc, intervals and QRS duration are normal.  The QRS frontal plane axis is normal and there is good R wave progression in the precordial leads.  There is ST segment elevation in Leads I, aVL, V2, and V3, with reciprocal ST depression in Leads III and aVF.  The ST segments that are elevated retain a relatively “normal” shape, being concave upward. There are no abnormal T wave inversions or pathological Q waves.

Dawn's picture

Acute M.I. With Right Bundle Branch Block and Atrial Pacing

This ECG was taken from a 78-year-old man who was experiencing chest pressure in the morning, after having left shoulder pain since the night before. He has a history of hypertension and hypercholesterolemia, and has an implanted pacemaker.

What does the ECG show?  The ECG shows an atrial paced rhythm, with two premature beats, beats number 5 and 12.  These are probably PVCs.  The patient has a functioning AV conduction system, so the paced atrial beats are conducting through the AV node and producing QRS complexes.  In the interventricular conduction system, the impulse encounters right bundle branch block. This causes each QRS to have an “extra” wave attached at the end, representing slightly delayed depolarization of the right ventricle.  Instead of an “rS” pattern in V1, for example, we see “rSR’ “.  The slight delay causes the QRS to be widened, as we are measuring the two ventricles separately, rather than synchronously.

There is definite ST segment elevation in V2 and V3, and the shape of the ST segment is straight, having lost it’s normal “concave upward” appearance.  In an ECG taken three minutes later, the STE extends to V4.

Do the pacemaker or the right bundle branch block prevent us from diagnosing an ST-elevation M.I.?  The answer to that is a resounding “NO!” Pacemakers can sometimes make it difficult to assess ST elevation because ventricular pacing causes ST segment changes.  Pacing the right ventricle causes a depolarization delay in the left ventricle as the impulse travels “cell to cell” across the LV.  This means an RV-paced beat will resemble a PVC from the RV.  When LV depolarization is altered, repolarization will also be altered, causing ST elevation in leads with negative QRS complexes, and ST depression is leads with upright QRSs. These are called discordant ST changes. These changes are proportionate to the height or depth of the QRS, with very minimal or no ST changes in leads with short or biphasic QRS complexes.  We don’t have to worry about that in this situation – the pacemaker is not pacing the ventricles.

Pages

All our content is FREE & COPYRIGHT FREE for non-commercial use

Please be courteous and leave any watermark or author attribution on content you reproduce.