Displaying 1 - 10 of 42
Dr A Röschl's picture

Right Bundle Branch Block

Why is this a right bundle branch block? We see a SR with broad QRS complexes (more than 120 ms). These are positive in the rightward leads III and especially in V1 and V2. In the more leftward leads I, aVL, V4-V6 there are clear S waves. This is a typical RBBB pattern.

Dr A Röschl's picture

Impending Trifascicular AV Block

Here we see the EKG of a 63-year-old man with CAD without relevant coronary stenosis. He complains of slightly reduced performance, but no other symptoms. The ECG shows the following changes:

Dawn's picture

Widespread ST Elevation With Right Bundle Branch Block

Usually, instructors of basic ECG classes look for examples of the most common conditions that are likely to be encountered by the learners.  But, sometimes, it is advantageous to show students more unusual presentations to remind them of the infinite possibilities when we care for living beings.  This series is a very good example of what can and does happen to some people with cardiovascular disease.  It will give your students an opportunity to think about possible interpretations, and also about anticipating clinical implications and emergencies that may arise.

The Patient:  This patient is a man in his 80s who has been active his whole life.  He considers himself to be healthy, giving no medical history and denying medication use. He states that he has had a yearly health exam.  Today, he felt “tired and dizzy” while raking leaves.  As he walked to his house to rest, he had a syncopal episode and fell, hitting his head. He was unconscious for a few minutes. A family member called for Emergency Medical Services (EMS). Paramedics found him awake and complaining of bilateral “shoulder and wrist” pain. He had no obvious trauma to his extremities, but had some bruising on his head and face.  He denied recent illness and substance abuse.  He was oriented x3. He was pale and diaphoretic, and complained of nausea. He denied chest or back pain.  He denied shortness of breath.  BP 100/60.  Heart rate bradycardic.  SPO2 above 95%.  He was given aspirin and ondasetron, and transported to a hospital.

Dawn's picture

Marked Bradycardia With Bifascicular Block

The Patient:    This ECG was taken from an elderly woman. Unfortunately, we do not know any details about the case.  That acknowledged, there are many interesting aspects to this ECG.

The ECG:  The first thing we notice is the severe bradycardia – almost certain to be symptomatic.  The rate is 32 bpm and the rhythm is regular.  There are no P waves.  This is a junctional rhythm, slightly slower than expected from junctional escape.

The QRS shows the presence of right bundle branch block.  Each QRS on the ECG starts as a narrow complex, but then adds an “extra” wave onto the end – the delay caused by the right ventricle depolarizing late.  The terminal delay is very noticeable in V1 as an R’ wave, and in Leads I and V6 as a small, wide s wave.  There is right axis deviation, so the diagnosis of bifascicular block (RBBB and left posterior fascicular block) can be made.

V2 through V6 show fragmentation of the QRS complexes and a loss of voltage and R wave progression.  This points to anterior wall M.I. We can’t know the age of the M.I. without clinical correlation, but the ST segments in those leads are very flat, with uniformly symmetrical inverted T waves all the way to V6.  All of these signs indicate recent injury.  An anterior M.I. can cause the bifascicular block we are seeing, since the bundle branches begin in the septum.

Dawn's picture

Wide Complex Tachycardia

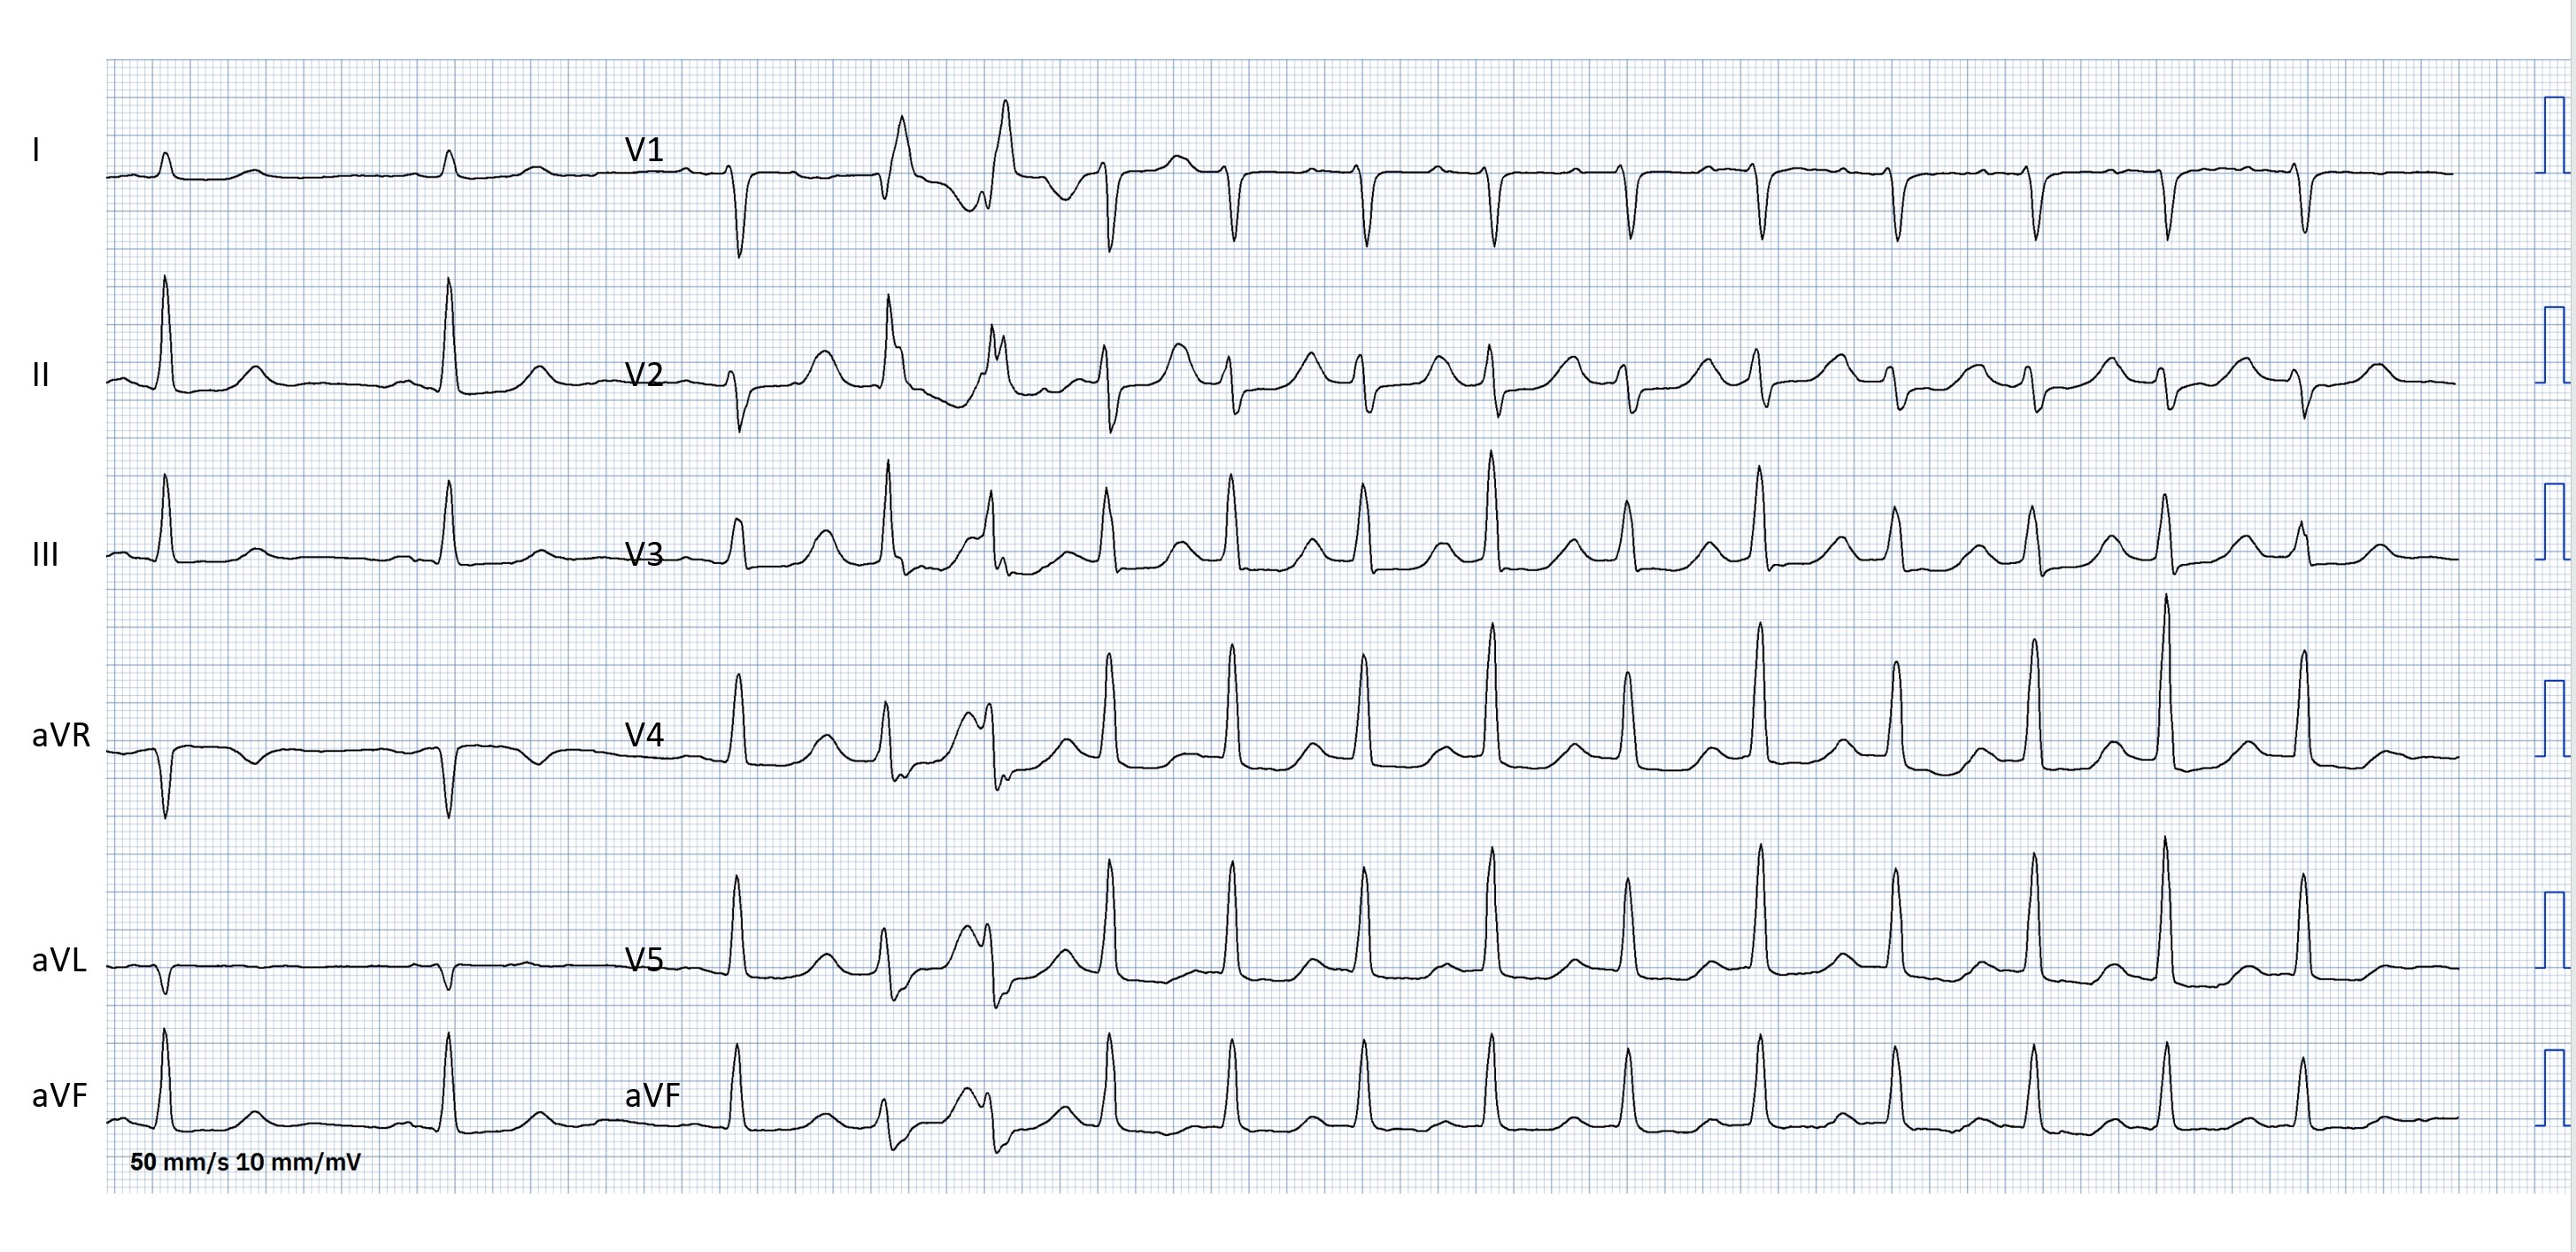
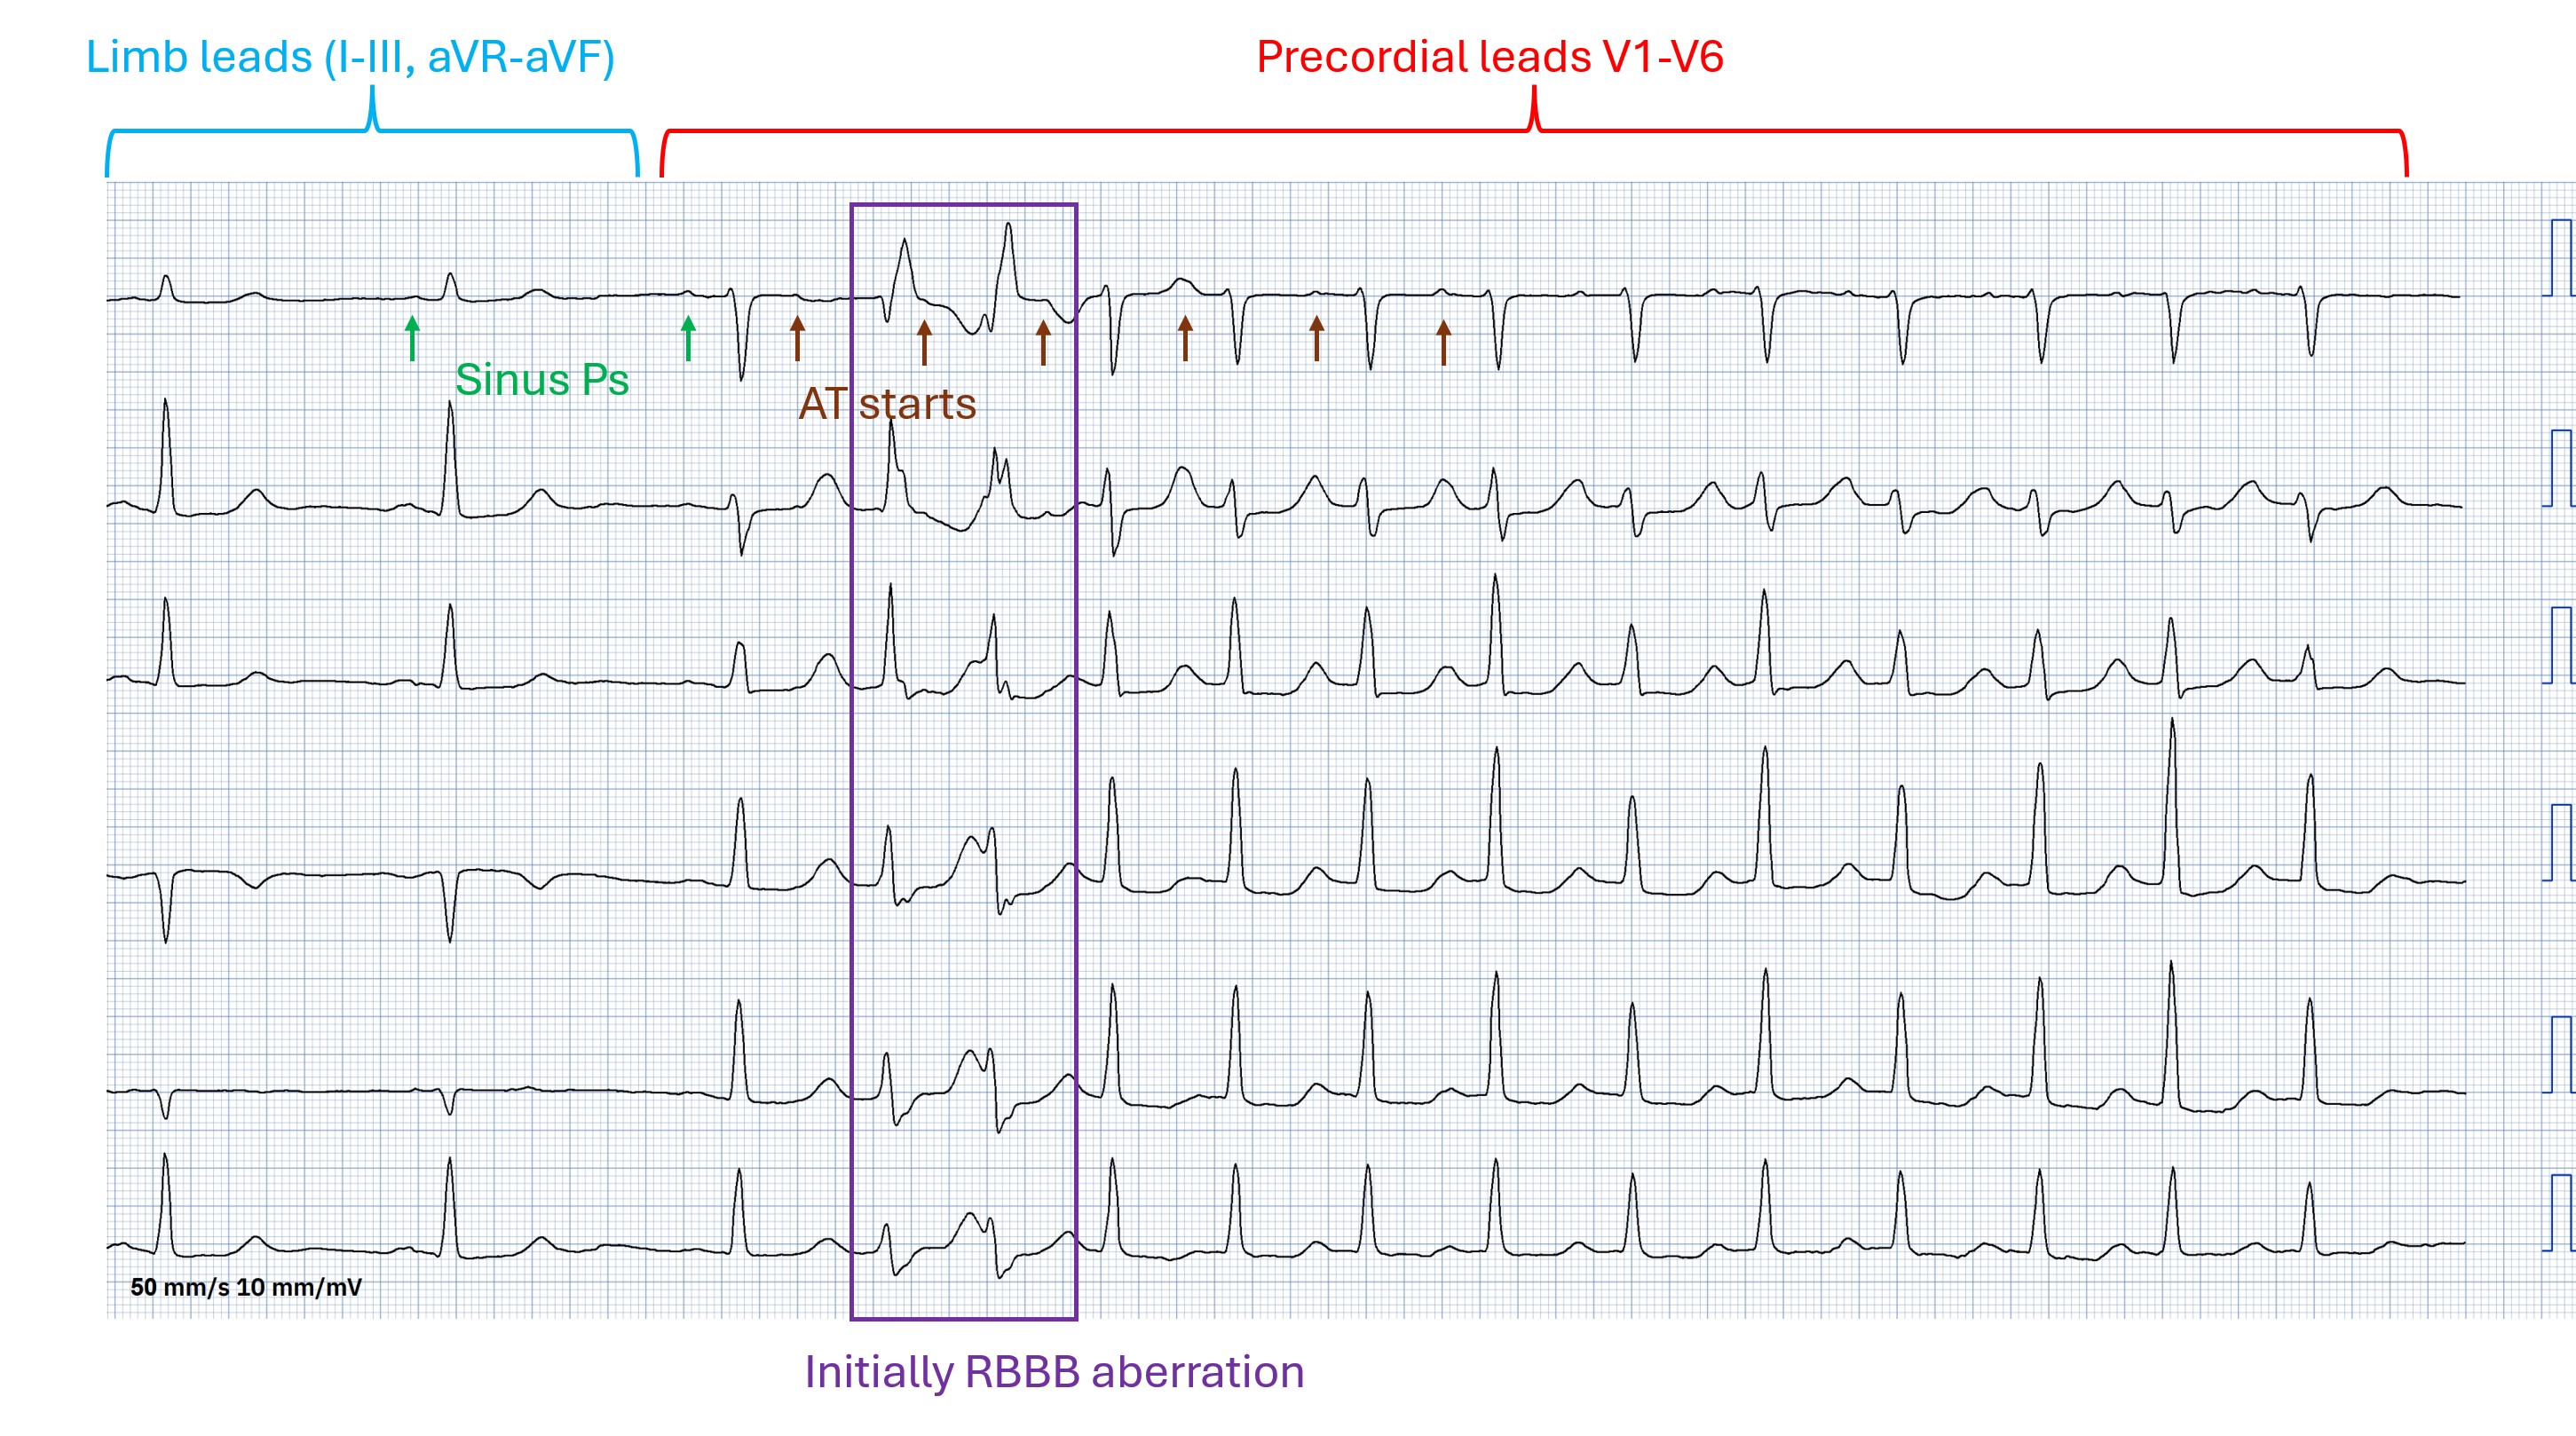
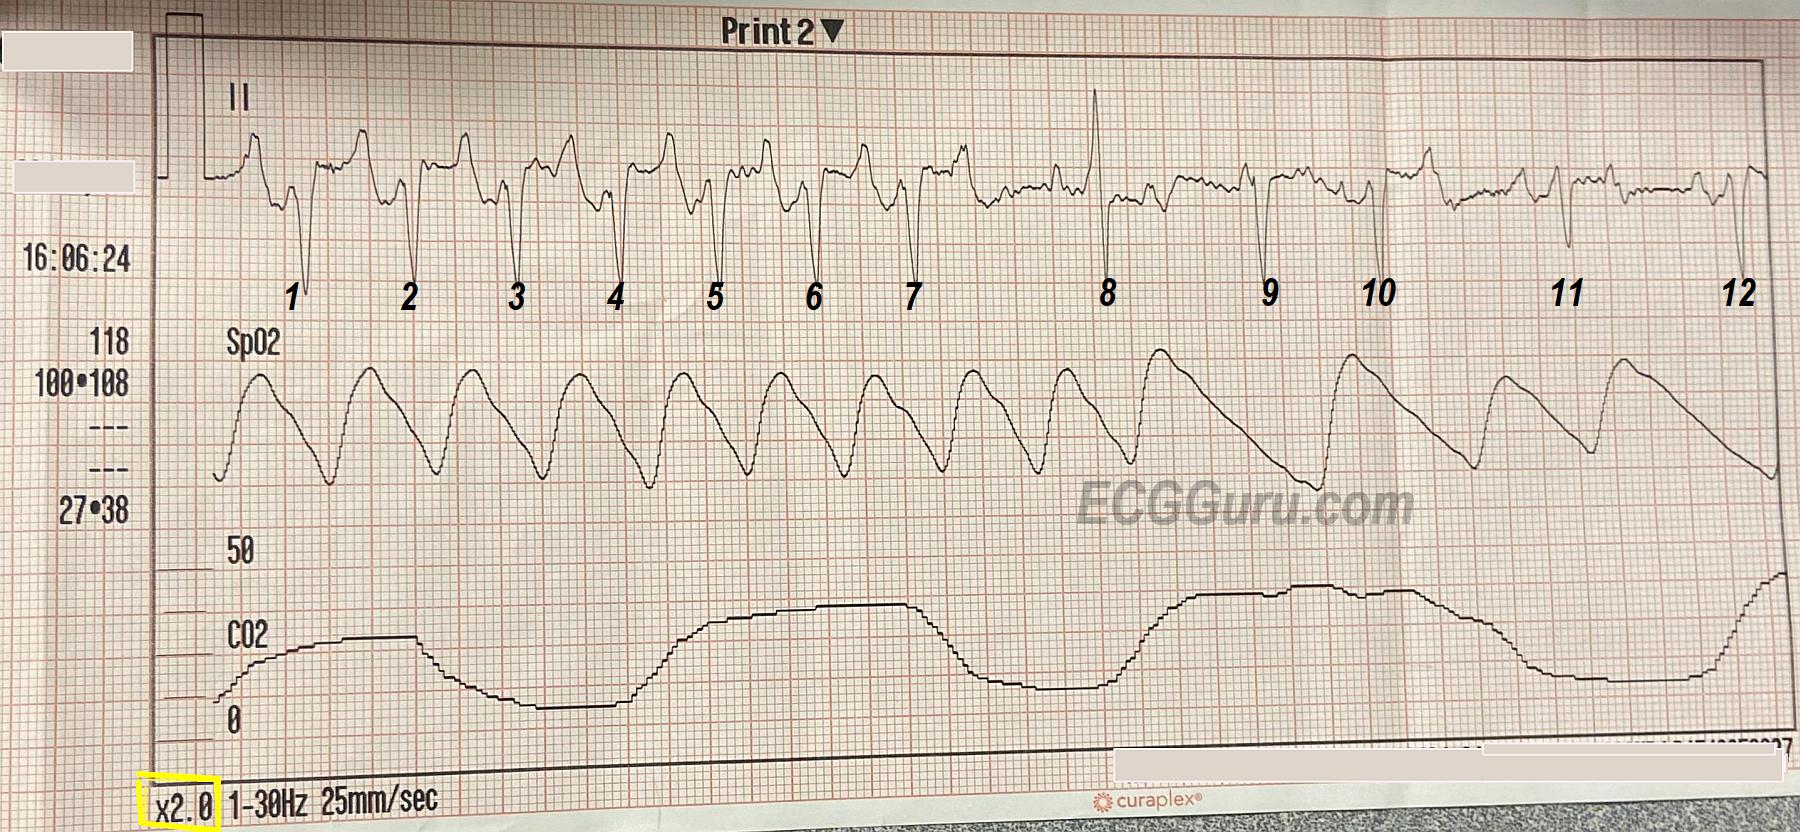
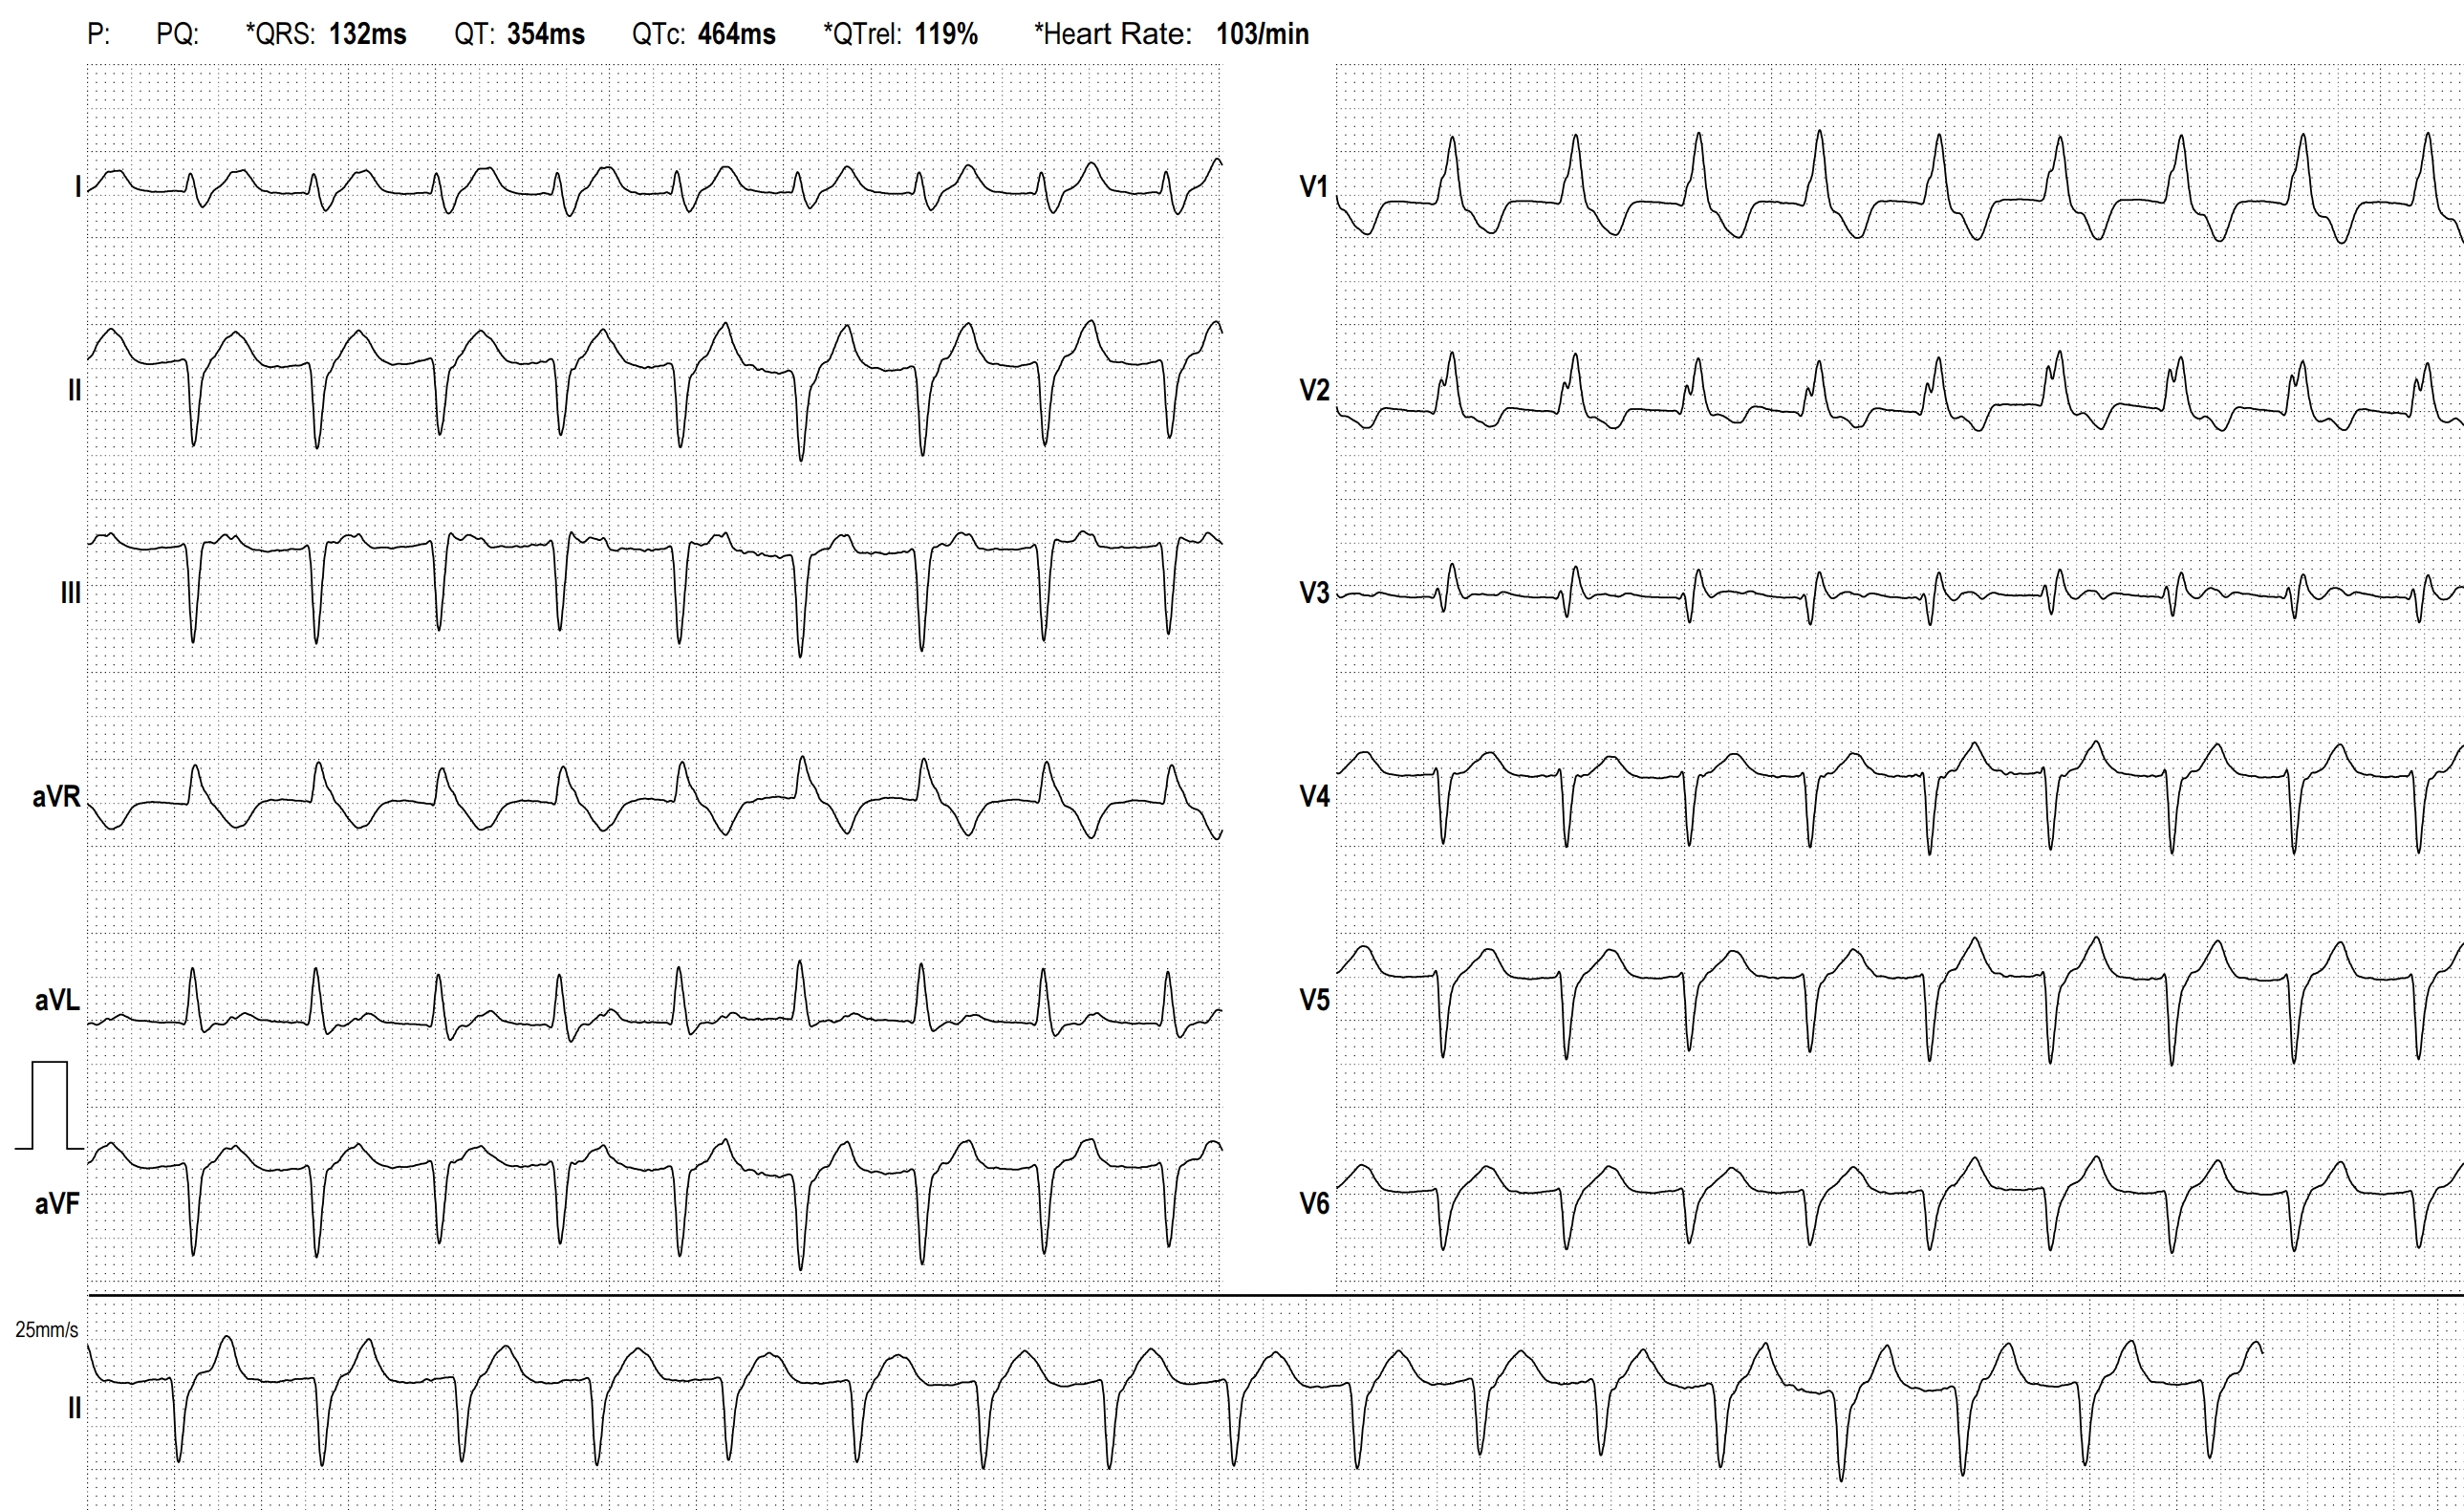
This pair of ECGs feature one of our recurring themes:  wide-complex tachycardia (WCT). It is a fascinating topic, as tachycardia has many causes and many mechanisms, and wide QRS also has many causes, with the mechanism being slow conduction through the ventricles. 

Sometimes, it is not possible to diagnose the true origin of a WCT from one ECG, or even serial ECGs.  Is the tachycardia due to increased sympathetic activity (fear, dehydration, exercise, hypoxia, hypovolemia, etc.)?  Or is the fast rate due to reentry, where one impulse gets “caught” in a loop, repeating itself rapidly, and depolarizing the myocardium with each pass?  What is the location of the pacemaker that is responsible for the rhythm?  Is it a supraventricular rhythm that has suffered an intraventricular conduction delay, widening the QRS?  Or is the rhythm originating in a ventricular pacemaker, without the ability to travel on the fast highway that is the intraventricular conduction system? 

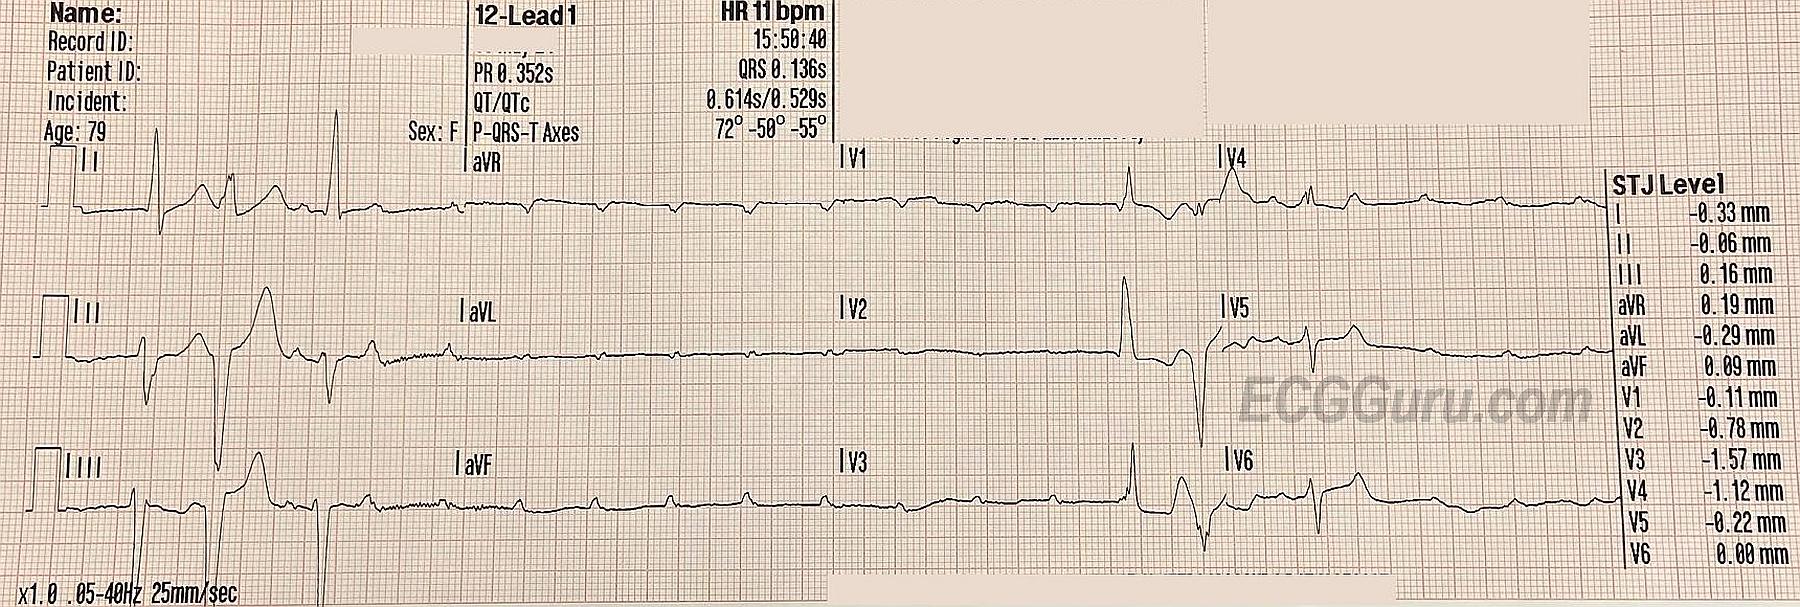
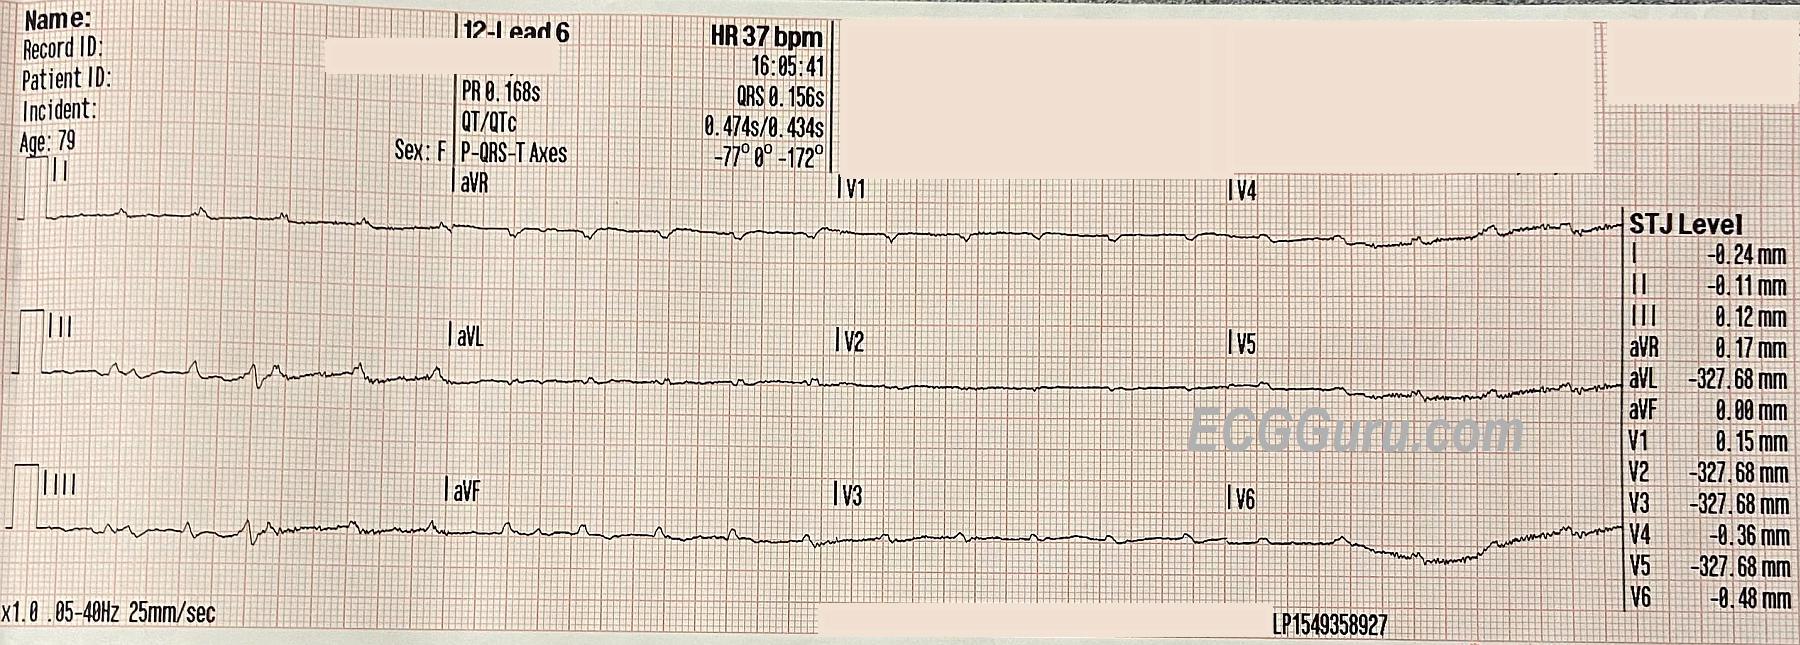
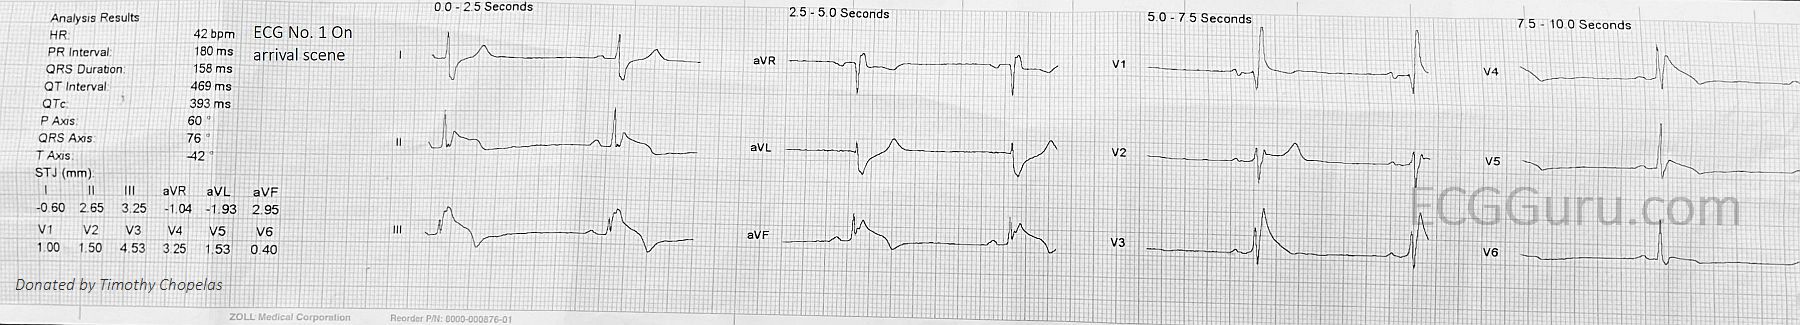
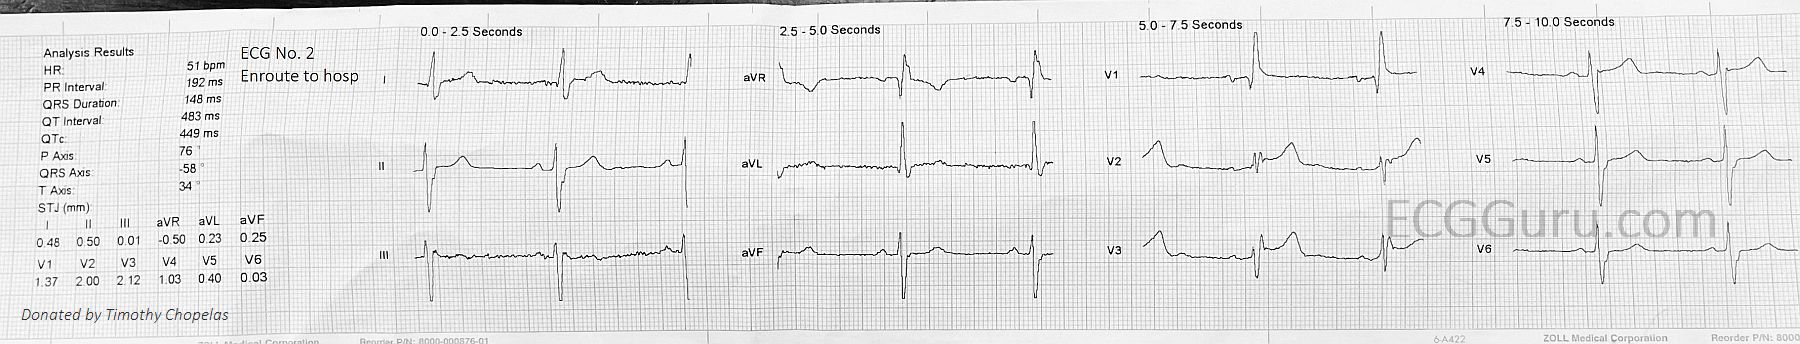
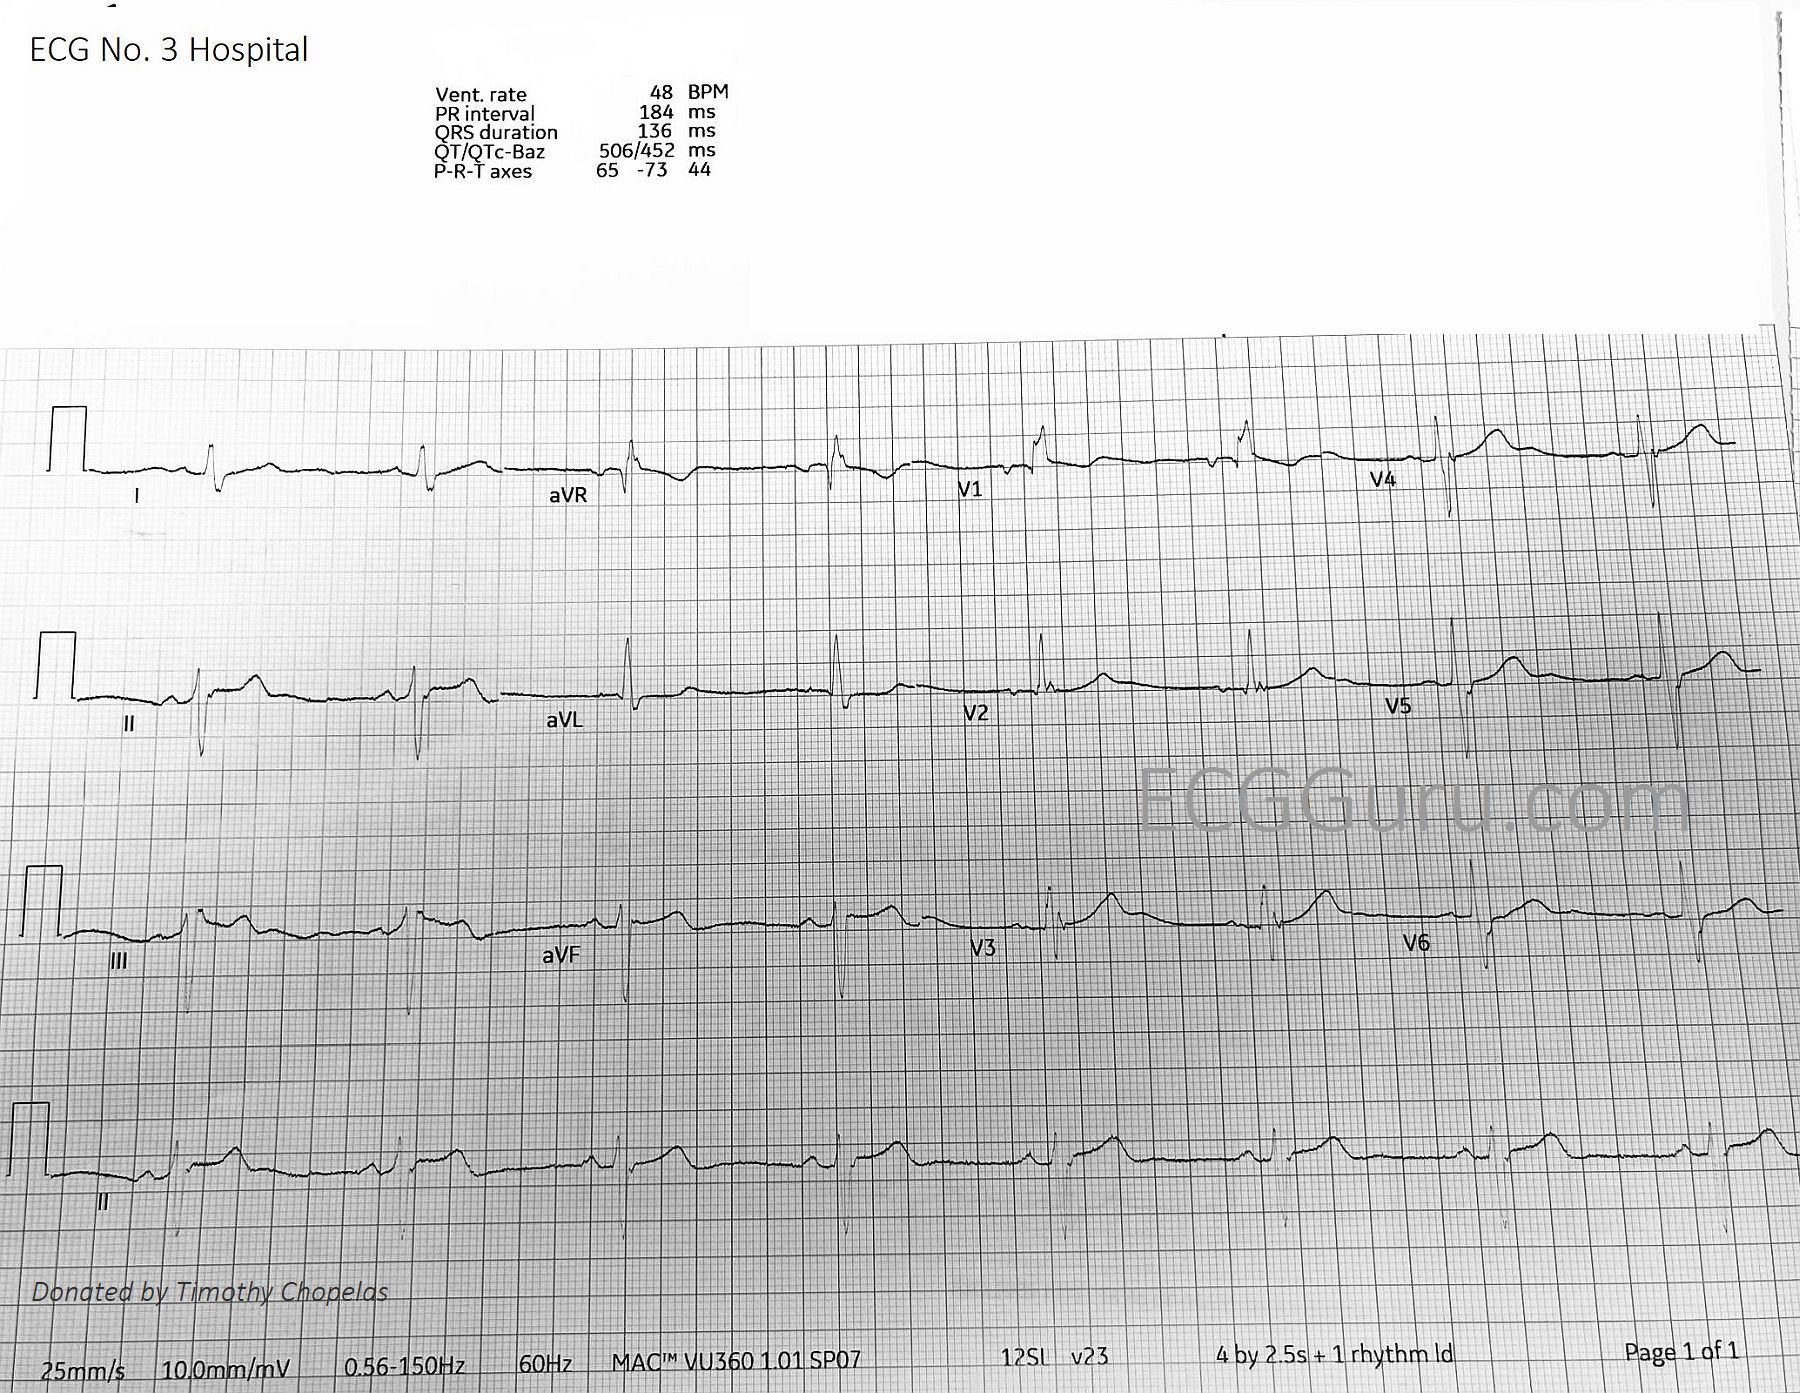
If you or your students work in an acute care setting, such as pre-hospital or emergency department, you may not be with the patient long enough or be able to conduct enough tests to determine without a doubt the answers to the above questions.  Some WCTs cause such severe symptoms that they must be dealt with quickly, to avoid rapid deterioration to ventricular fibrillation.  For that reason, there is a widely-accepted rule for WTC treatment:

TREAT ALL WIDE-COMPLEX TACHYCARDIA AS IF IT IS V TACH UNTIL PROVEN OTHERWISE.    

Dawn's picture

Second-degree AV Block, Type II

The patient:  Unfortunately, we no longer have information on this patient, other than the fact that she went to the OR for a permanent pacemaker implantation.

The ECG:  The atrial rate (P waves) is 99 beats per minute. The P waves are regular and all alike (NSR). The ventricular rate (QRS complexes) is 33 bpm, and the QRS complexes are regular and all alike. The PR intervals, when A-V conduction occurs, are 162 ms (.16 seconds) and all alike. The QRS complexes are wide, at 122 ms (.12 seconds). There is right bundle branch block, but no left hemiblock, as the frontal plane axis is normal. The QTc is prolonged at 549 ms.  Many ST segments on this ECG have a “flat” appearance, rather than the normal concave up shape.

The failure of 2 out of every 3 P waves to conduct indicates a second-degree AV block. Type I is a block of the AV node, with progressive prolongation of the PR interval until ONE P wave fails to conduct. Type II AV block is a block of the intraventricular conduction system. Clues that a second-degree AV block is Type II include:

·        The PR intervals are all alike.

·        More than one consecutive P wave is not conducted.

·        A P wave that is NOT in the refractory period of the preceding beat is not conducted.

Dawn's picture

Right Bundle Branch Block and More

The Patient:    These tracings are taken from a 75-year-old man who became weak while playing golf on a very hot day.  He was pale and diaphoretic.  He was hypotensive, but we do not know his BP reading. He denies chest pain or discomfort. The patient reported a history of lung cancer and hypertension. We have no other history, and unfortunately, no follow-up information.

ECG Number 1:           The first ECG shows the standard 12 leads.  The rhythm is sinus with frequent appearances of PAC couplets.  The sinus rate varies slightly from about 76 bpm to 68 bpm, tending to slow a bit after the premature atrial contractions.  There is a right bundle branch block, and the QRS duration is about .12 seconds (120 ms). The PR interval is slightly log at 223 ms.  We do not know what medications the patient is on, and we do not have an older ECG for comparison.

There are some interesting, if subtle, changes worth mentioning.  The QRS complexes in most leads are fragmented.  That is, they have notching in the terminal S or R waves that is not due to the bundle branch block. This can be a sign of scarring, and can also be considered an equivalent to a pathological Q wave.  Speaking of pathological Q waves, they are seen in the inferior leads, II, III, and aVF.  There are also prominent, though not large Q waves in V4 through V6, leads which normally do not have them. All this points to scarring and possibly long-term coronary artery disease, with possible old M.I.  In addition, the ST segments are not entirely normal.  There is ST depression in the inferior and low lateral leads, a little ST elevation in aVL.  Also, the SHAPES of the ST segments tend to be straight throughout the ECG, instead of the usual curved (concave up) appearance.

Dawn's picture

High-grade AV Block With Profound Bradycardia

If you are an ECG instructor, you probably carefully choose ECGs to illustrate the topic you are teaching. One of the reasons for the existence of the ECG Guru website is our desire to provide lots of such illustrations for you to choose from.

Sometimes, though, an ECG does not clearly illustrate one specific dysrhythmia well, because the interpretation of the ECG depends on so many other factors.  In order to get it “right”, we would need to know information about the patient’s history, presentation, lab results, or previous ECGs. We might need to see the ECG done immediately before or after the one we are looking at.  Some ECG findings must ultimately be confirmed by an electrophysiology study before we can know for sure what is going on.

For those of us who are “ECG nerds”, it can be fun to debate our opinions and even more fun to hear from wiser, more advanced practitioners about their interpretations.

My belief, as a clinical instructor, is that we must teach strategies for treating the patient who has a “controversial” ECG that take into account the level of the practitioner, the care setting, and the patient’s hemodynamic status.  In some settings, it might be absolutely forbidden for a first-responder to cardiovert atrial fibrillation, for example.  But atrial fib is routinely cardioverted under controlled conditions in hospitals.  The general rule followed by emergency providers that “all wide-complex tachycardias are v tach until proven otherwise” has no doubt prevented deaths in situations where care providers did not agree on the origin of the tachycardia.

The ECG:    We do not have much patient information to go with this ECG, just that it is from a 71-year-old woman who developed severe hypotension and lost consciousness, but was revived with transcutaneous pacing.   Here is what we do know about this ECG:

·        There are regular P waves, at a rate of about 39 bpm (sinus bradycardia).

Dawn's picture

Shark Fin Pattern

The Patient:  This ECG is from a 59-year-old woman who was found by the EMS crew to be unresponsive, with agonal respirations at about 6 breaths per minute. Her pulse was thready at the carotid, and absent peripherally. Her skin was pale, cool, and mottled.  Her BP via the monitor is 81/40, peripheral pulses not being palpable.  An initial rhythm strip showed sinus rhythm at 75 bpm with right bundle branch block and ST elevation.

The patient’s husband gave a history of “difficulty breathing” since sometime this morning, alcohol dependence, hypertension, tobacco use, and insomnia. He said she had been drinking heavily for several weeks.

She was immediately ventilated and intubated, and an intraosseous infusion line established.  A12-lead ECG was done, and it showed a dramatic change in the rhythm and ST segments over the initial strip. She was transported to a nearby hospital with CPR support. She achieved return of spontaneous circulation (ROSC) at the Emergency Department, after having three doses of epinephrine.  Follow up with the ED physician revealed that the patient had suffered a massive gastrointestinal bleed.  This patient, due to loss of a critical amount of blood, had low blood pressure and very poor perfusion, which resulted in damage to her heart (and possibly other organs as well). I do not have further follow up, but will update this if I receive more information. 

Dawn's picture

Tachycardia In An Unresponsive Patient

 The Patient     This ECG was obtained from a 28-year-old woman who was found in her home, unresponsive.  She was hypotensive at 99/35.  No one was available to provide information about past medical history or the onset of this event.

Before you read my comments, pause to look at the ECG and see what YOU think.  We would welcome comments below from all our members!

The ECG     This ECG is quite challenging, as it illustrates the helpfulness of ECG changes in patient diagnosis, and also points out how important clinical correlation is when the ECG suggests multiple different problems. Forgive me in advance, but there is a lot to say about this ECG.

The heart rate is 148 bpm, and the rhythm is regular, although not perfectly. P waves are not seen, even though the ECG machine gives a P wave axis and PR interval measurement. The rate is fast enough to bury the P waves in the preceding T waves, especially if there is first-degree AV block. Differential dx: sinus tachycardia, PSVT, atrial flutter. The very slight irregularity points more towards sinus tachycardia.  The rate of nearly 150 suggests atrial flutter with 2:1 conduction, but the only lead that looks remotely like it has flutter waves is V2. The lack of an onset or offset of the rhythm makes it difficult to diagnose PSVT with any certainty.

Pages

All our content is FREE & COPYRIGHT FREE for non-commercial use

Please be courteous and leave any watermark or author attribution on content you reproduce.