

All our content is FREE & COPYRIGHT FREE for non-commercial use
Please be courteous and leave any watermark or author attribution on content you reproduce.
Recent blog posts
- New Interactive ECG Quizzes
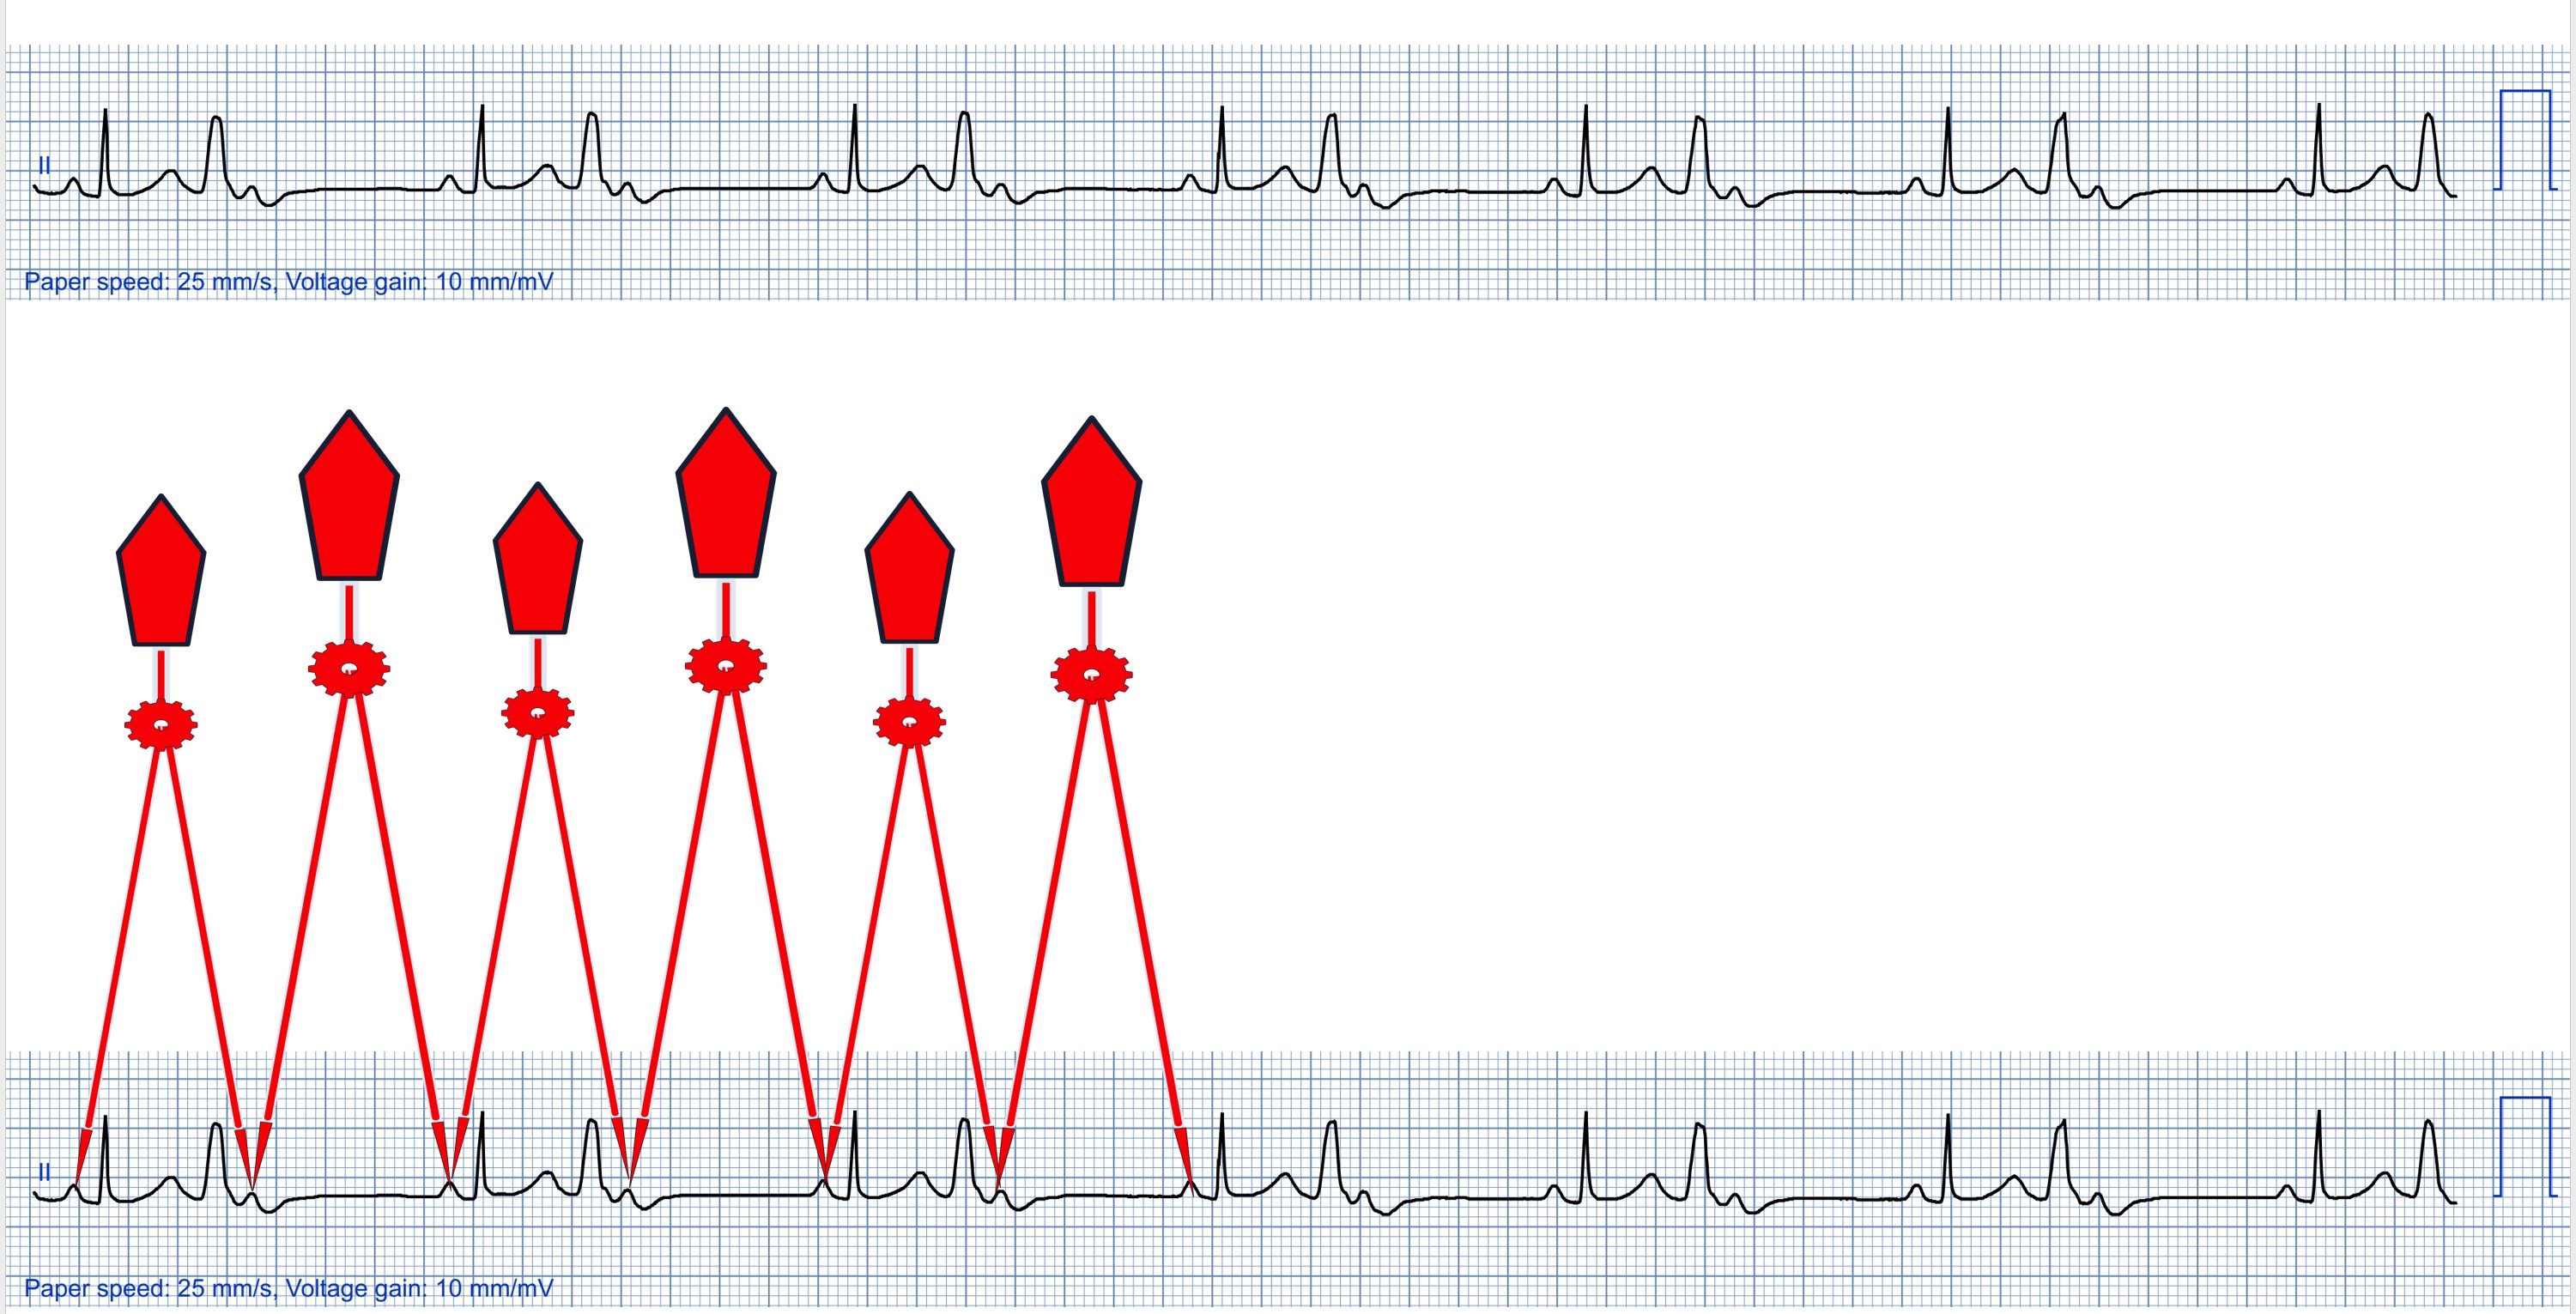
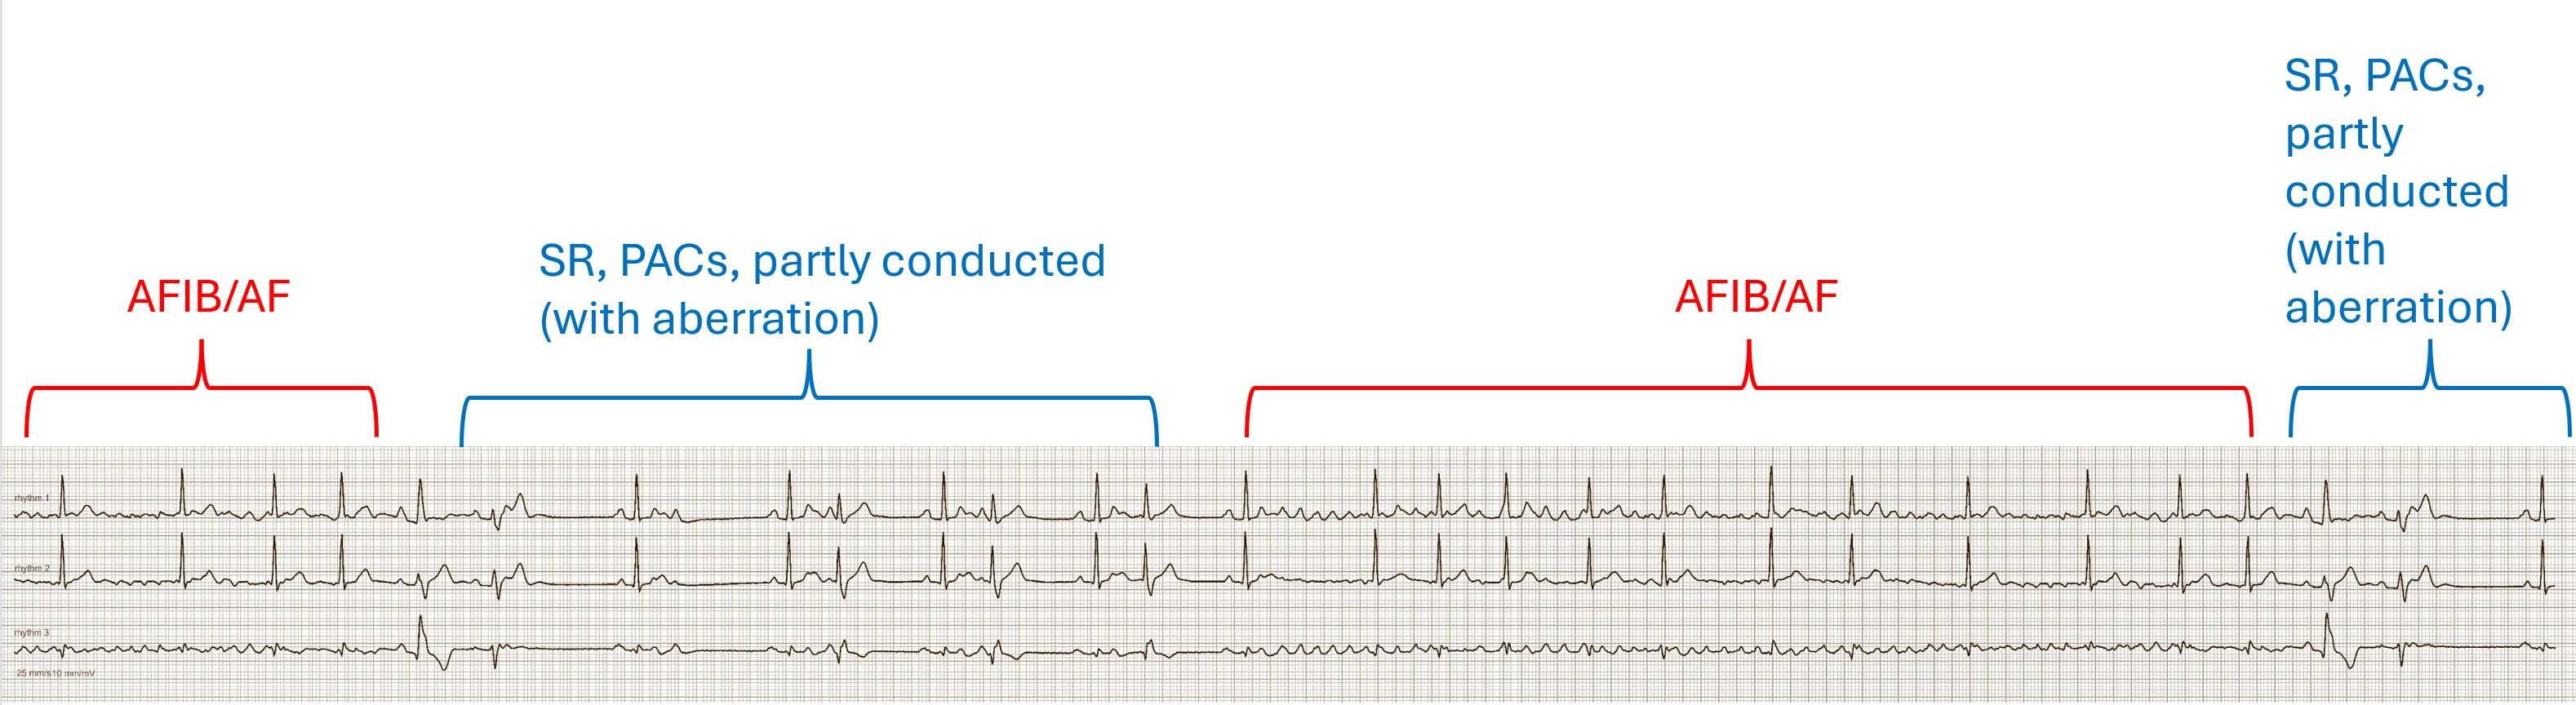
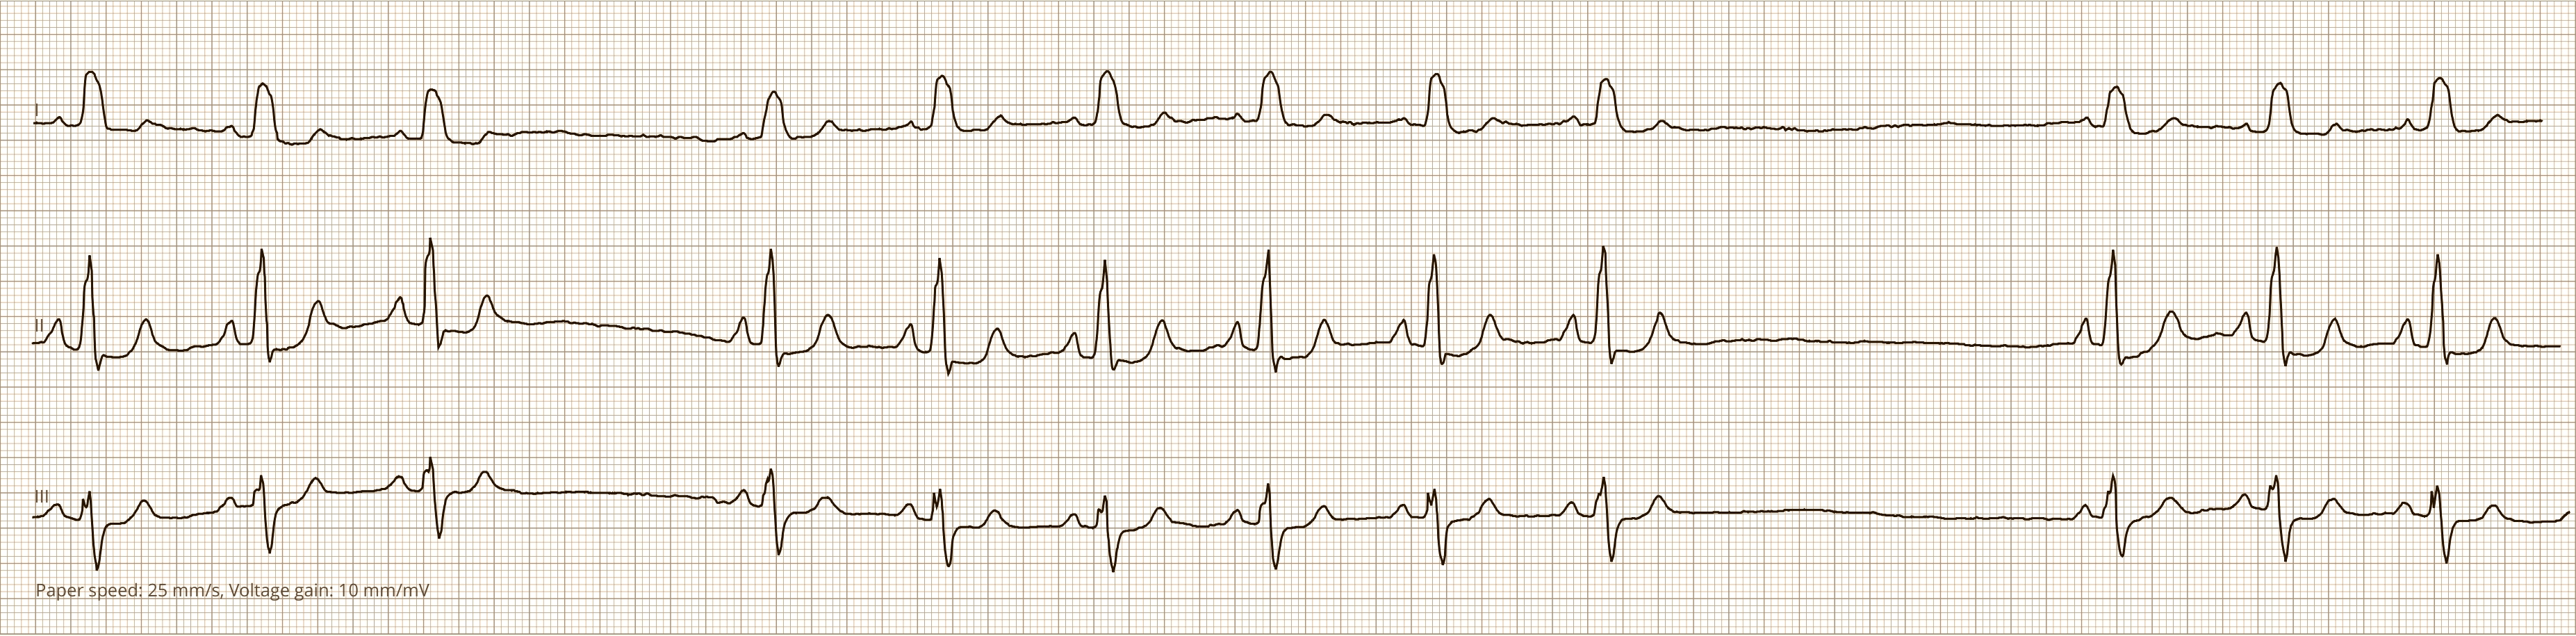
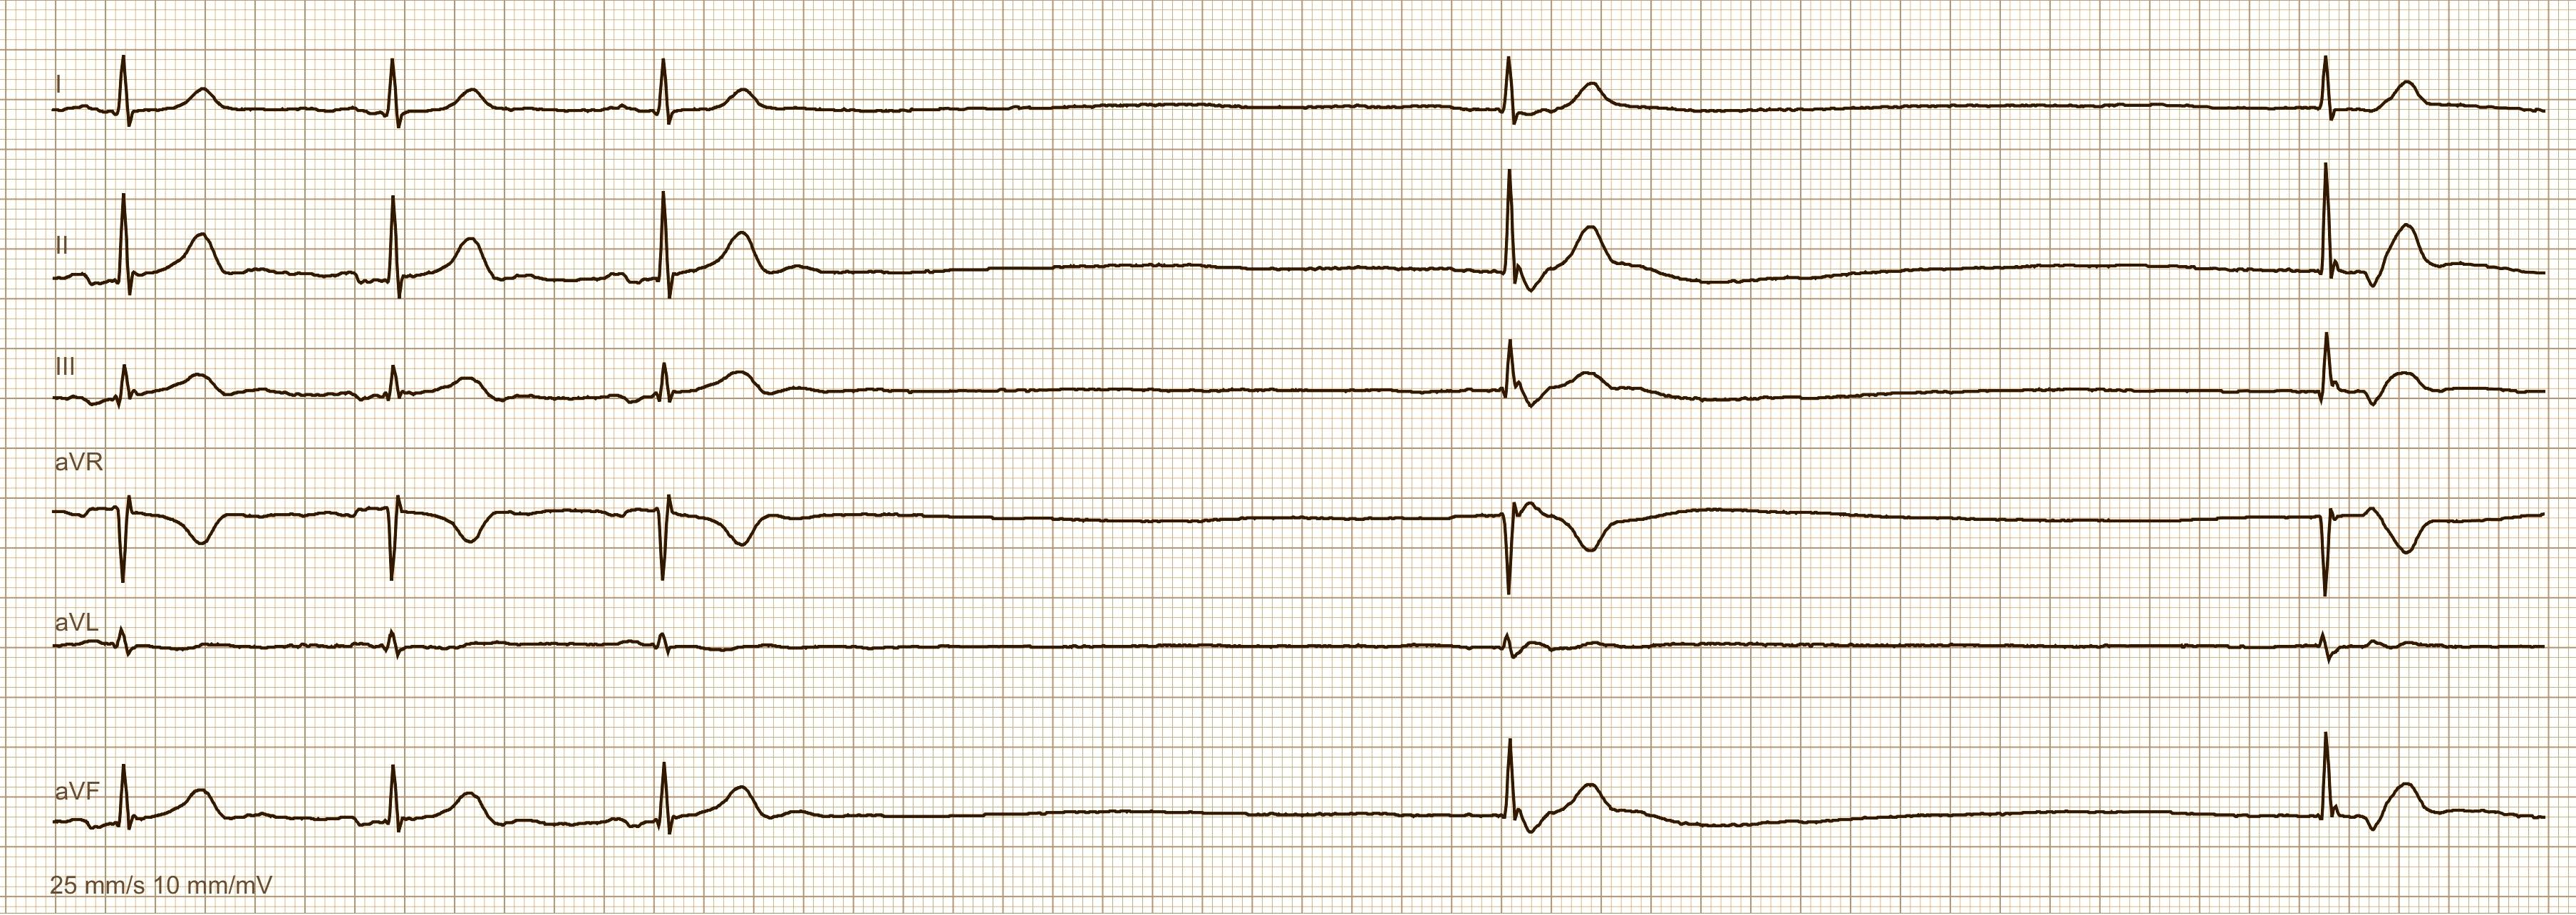
- PACS WITH ABERRANT CONDUCTION
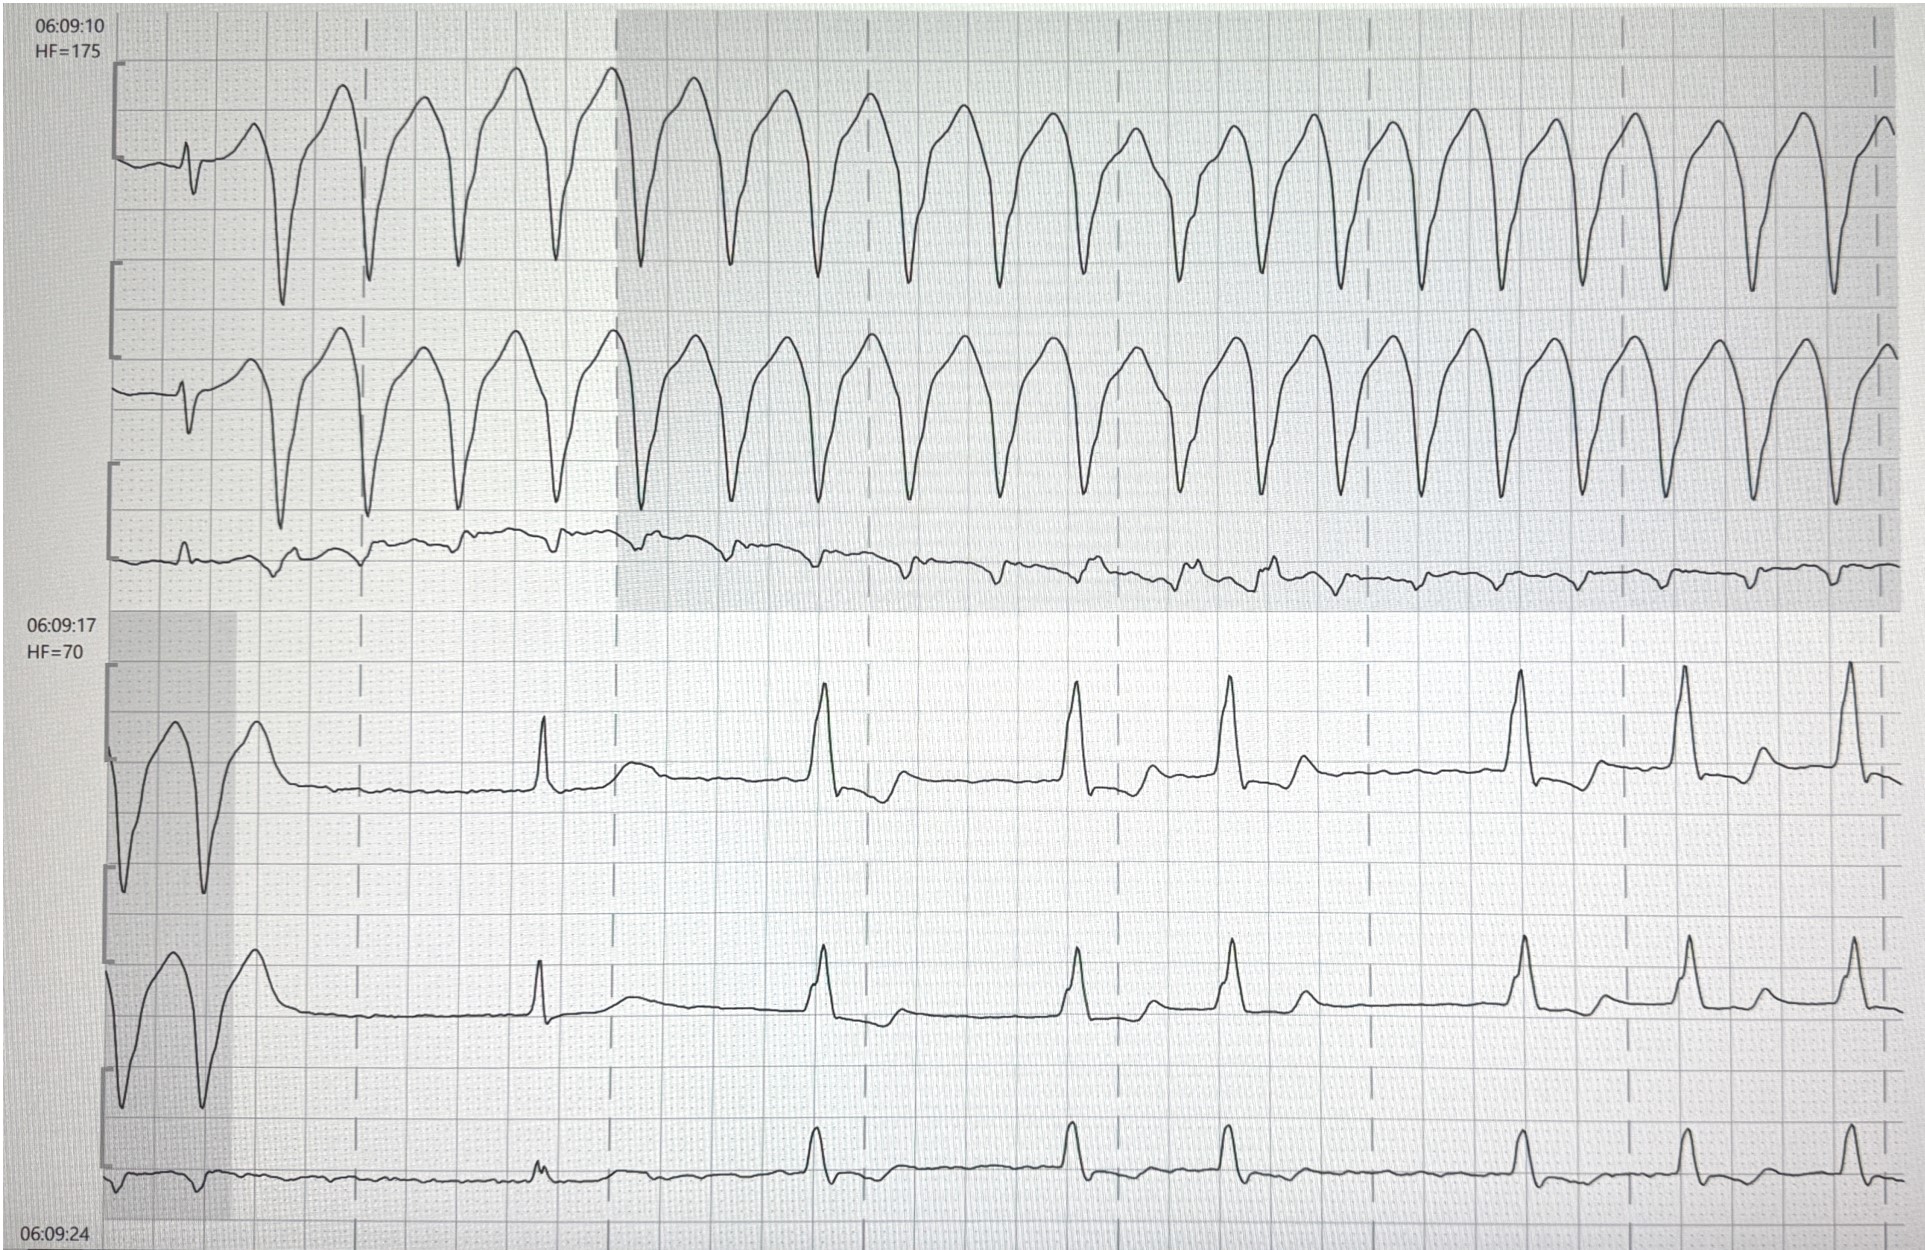
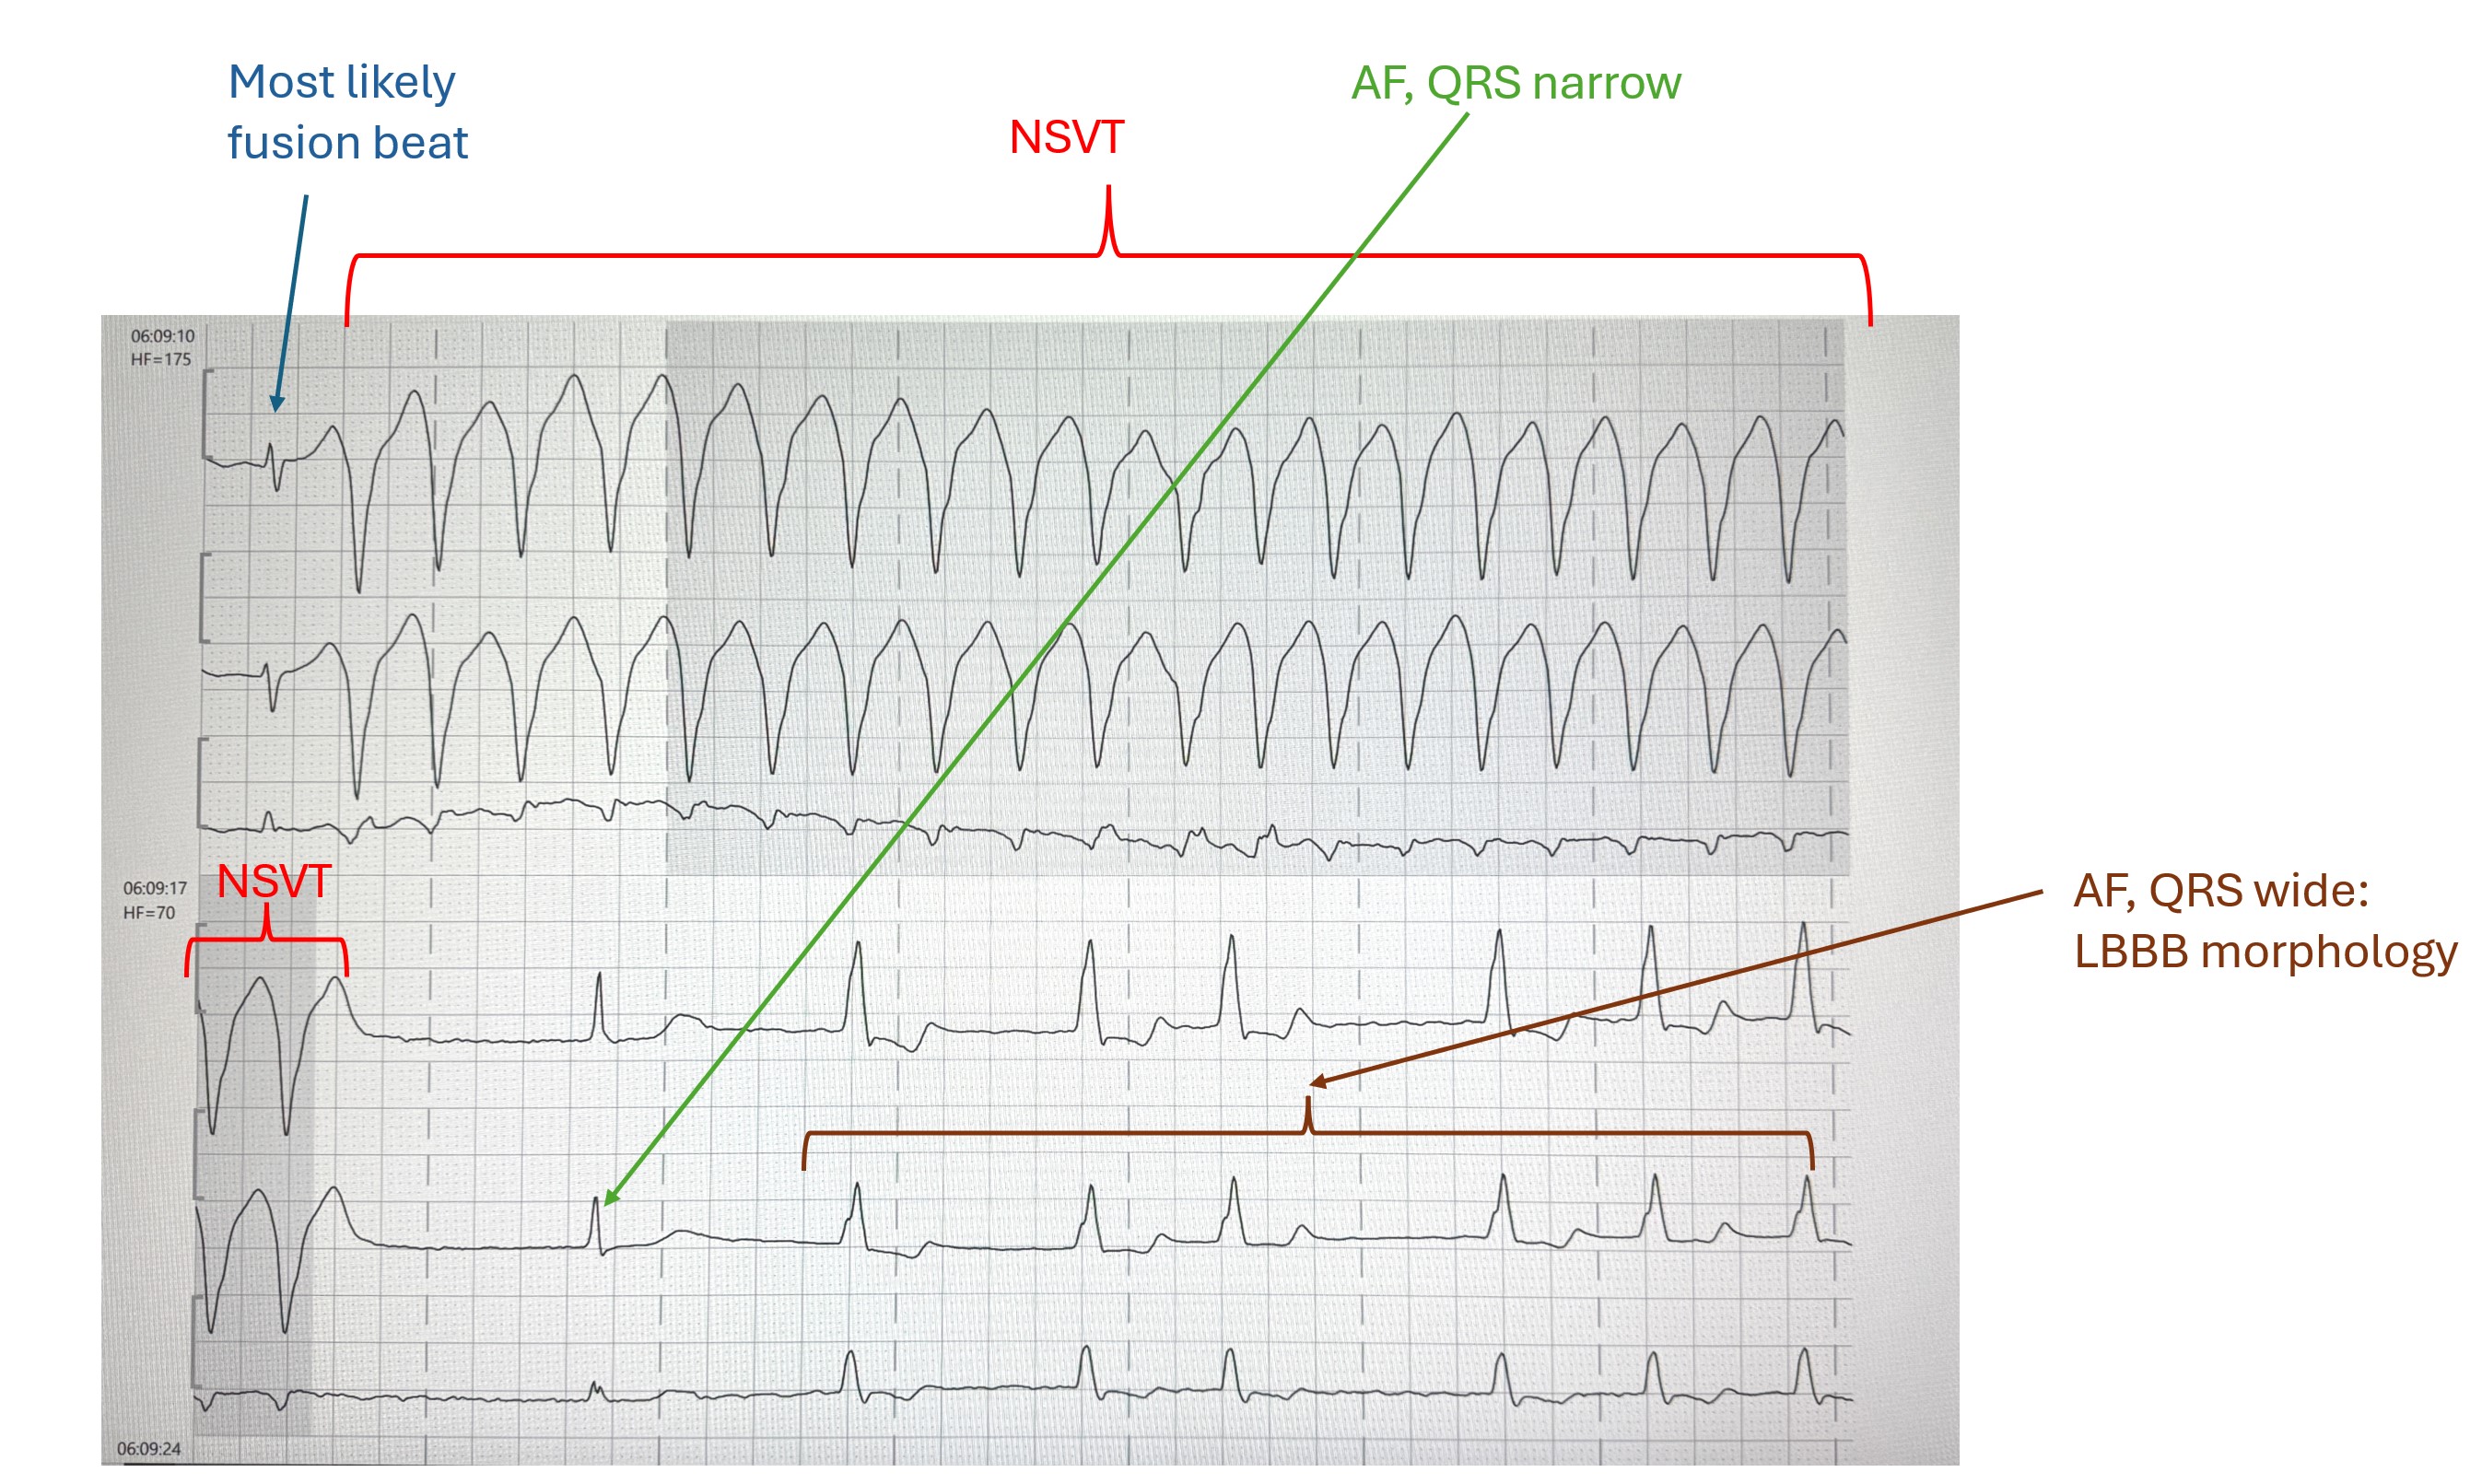
- HOLTER ECG: FAST VT, ATP, ICD SHOCK
- AIVR
- COMPLETE AV BLOCK
- HIGH GRADE AVB
- JUNCTIONAL ESCAPE RHYTM
- POLYMORPHIC VT
- SGARBOSSA CRITERIA
- CONCEALED CONDUCTION
- CONCEALED CONDUCTION AND VENTRICULOPHASIC SINUS ARRHYTHMIA
- PAROXYSMAL ATRIAL FIBRILLATION
- 2nd Degree Sino-atrial Exit Block, Mobitz Type II
- SICK-SINUS-SYNDROME
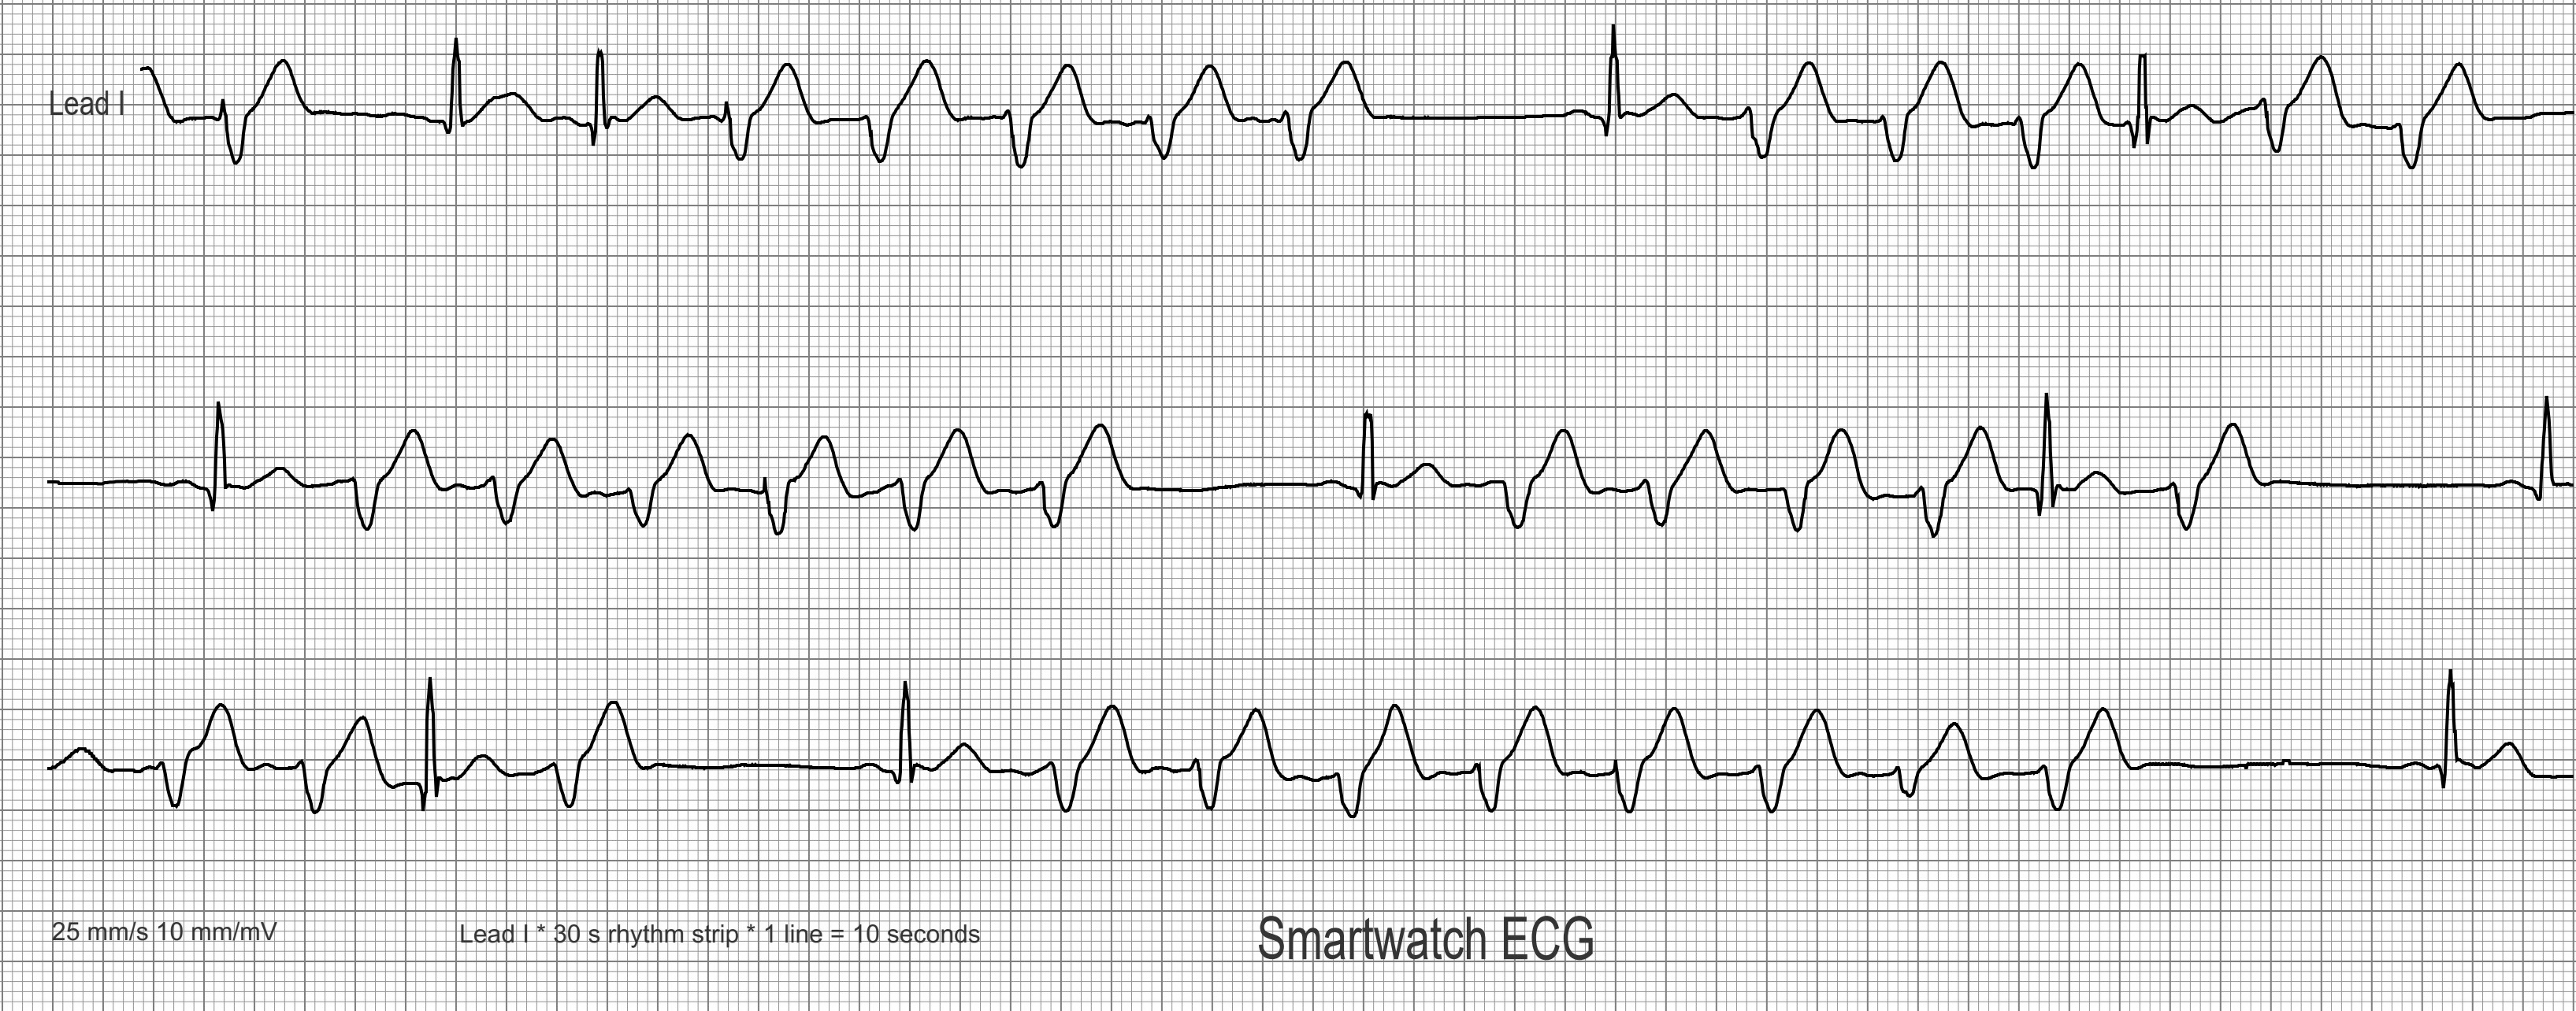
- Smartwatch Rhythm Strip