Dawn's picture

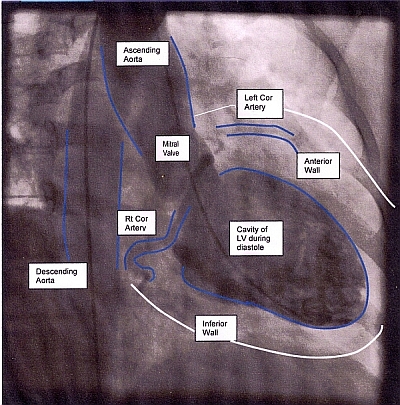
Takotsubo Cardiomyopathy Ventriculogram


This ventriculogram shows the typical apical ballooning of the left ventricle during Takotsubo myocardiopathy.  This serious condition can be caused by extreme stress, such as in the death of a loved one, or prolonged high stress levels.  The ECG will usually show ST elevations indicating an anterior wall M.I., but the angiogram will show no arterial occlusions.  Takotsubo myopathy causes a sudden onset of congestive heart failure.  It is transient, and those who survive it generally recover fully.  For an excellent and complete discussion of Broken-Heart Syndrome,

jer5150's picture

Jason's Blog: ECG Challenge of the Week for March 24th - 31st.

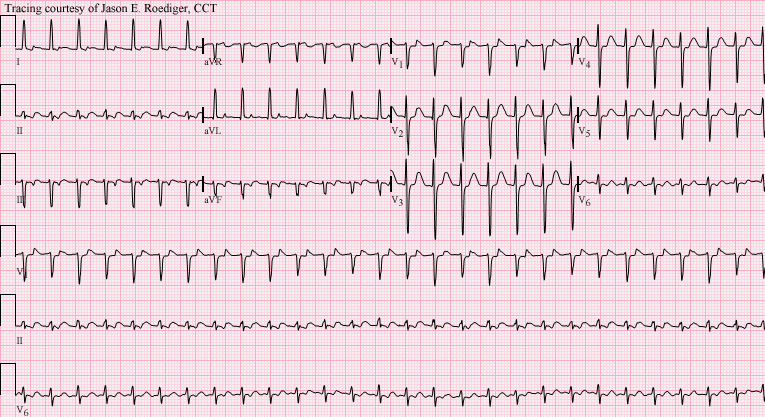
Patient's clinical data:  47-year-old black man.  Another serial ECG (seen below) showed a supraventricular tachycardia (SVT) at a rate of 164/min that was diagnosed by an Electrophysiologist as atrioventricular nodal reentrant tachycardia (AVNRT).  How does knowing the mechanism of AVNRT help you in determining the nature of the mechanism in this week's ECG.  

Dawn's picture

Using Ventriculograms to Enhance Your ECG Classes

The ECG Guru now has a You Tube site where you can find videos to enhance your classes.  As with all ECG Guru content, there is no charge and no copyright.  Ventriculograms are often obtained during a cardiac cath procedure. A curved, or pigtail, catheter is inserted through the arterial access line into the aorta and then the left ventricle.  Contrast is introduced into the left ventricle and the pumping function of the ventricle can be observed.  The structure and function of the aorta and mitral valve may also be observed during this procedure.

Dawn's picture

Normal Ventriculogram


At this link, you will find a ventriculogram showing a normally-functioning left ventricle with an excellent ejection fraction.  For your students, ventriculograms can illustrate muscle function visually, and are a great aid when teaching ECG.  Watch the ECG Guru website and YouTube page for more ventriculograms and other cath lab videos.

jer5150's picture

Jason's Blog: ECG Challenge of the Week for March 17th - 24th.

Patient's clinical data:  Unknown aged white man.

What well-known eponym can technically be applied to this 12-lead ECG?  HINT:  It takes on a somewhat unusual form here.

jer5150's picture

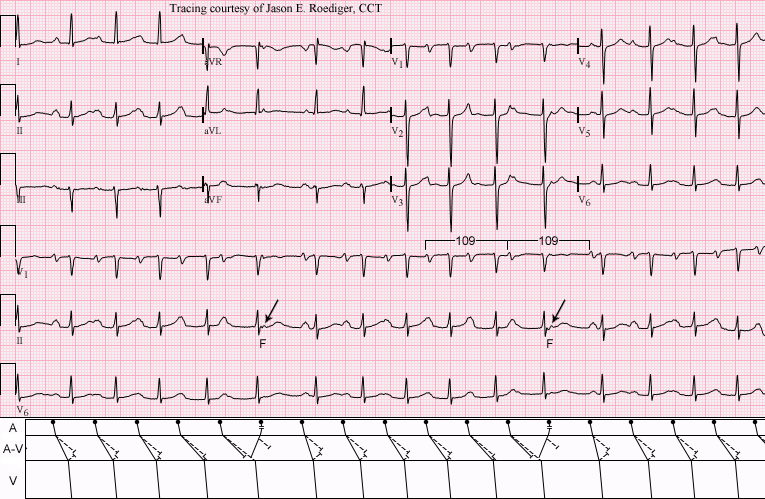
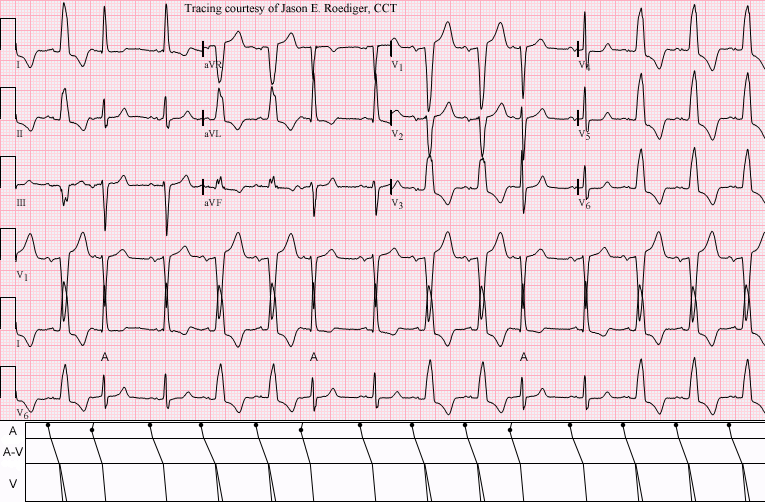
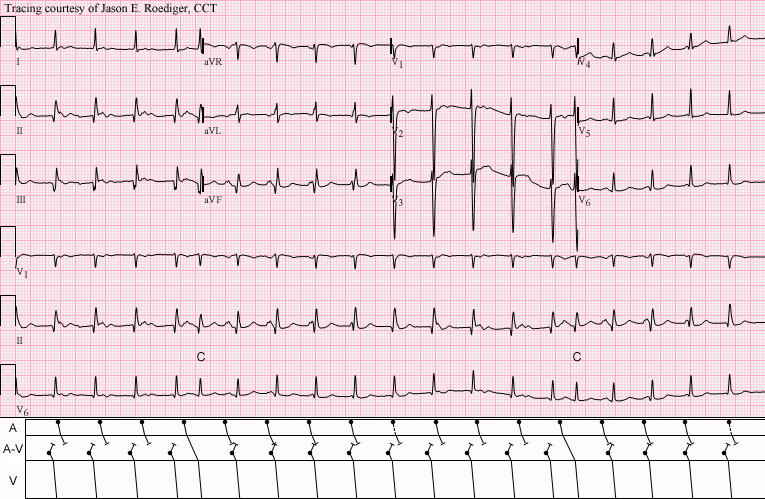
Jason's Blog: ECG Challenge of the Week for March 10th - 17th. Mutual mimics

These are two 12-lead ECGs that I performed on two completely different patients several years apart. 

Patient's clinical data (Top ECG):
57-year-old black man

Patient's clinical data (Bottom ECG):
67-year-old black man

Are both of these ECGs showing the same rhythmic pattern?

Steven's picture

VG Stunned Inferior Wall


jer5150's picture

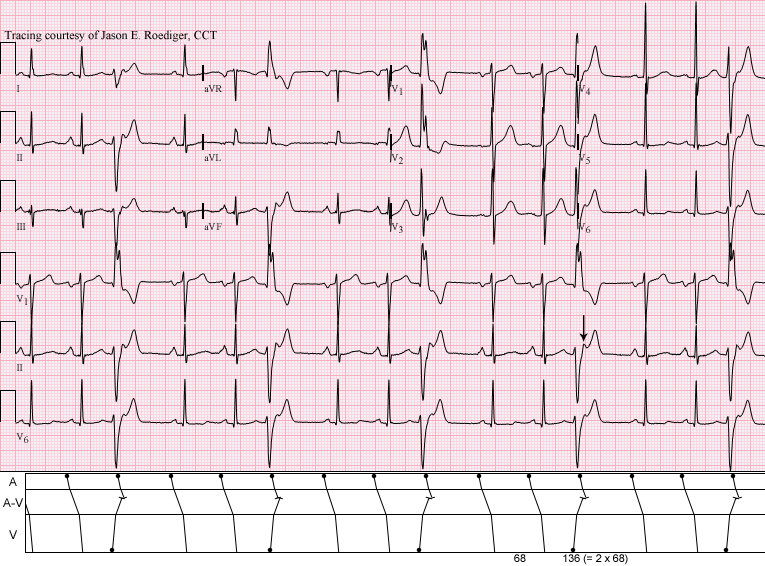
Jason's Blog: ECG Challenge of the Week for Feb. 24th - March 3rd.

Patient's clinical data:  55-year-old white man admitted to the surgical intensive care unit (SICU). 

Part of the computer's interpretation was:
Sinus tachycardia 1st degree AV block Occasional
Premature supraventricular complexes

DO YOU AGREE WITH THE COMPUTER?

jer5150's picture

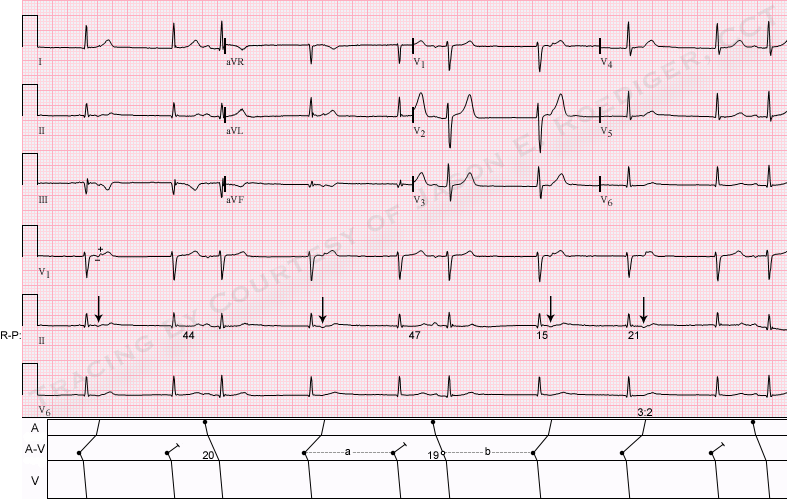
Jason's Blog: ECG Challenge of the Week for Feb. 17th - 24th.

Patient's clinical data:  81-year-old black man

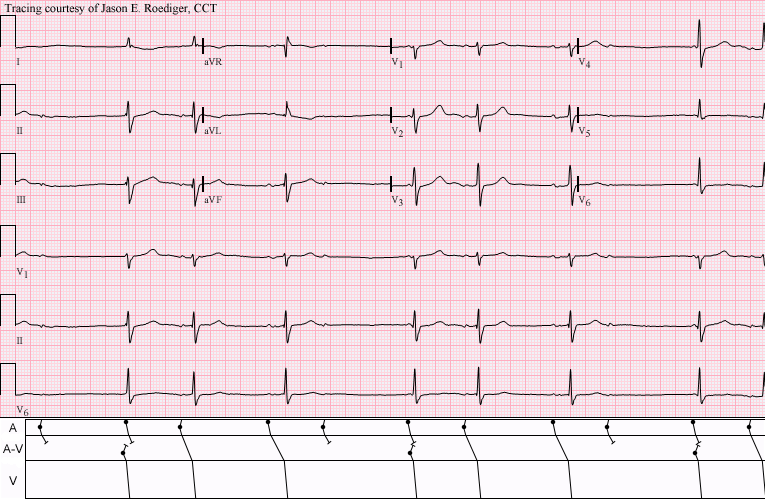
The computer interpreted this ECG as: 
Sinus bradycardia 1st degree AV block
ST abnormality, possible digitalis effect
Abnormal ECG
When compared with ECG of (expunged)
PR interval has increased

Pages

All our content is FREE & COPYRIGHT FREE for non-commercial use

Please be courteous and leave any watermark or author attribution on content you reproduce.